


The Cost of Playing Defense
Another week, another reminder that volatility cuts both ways, and lately, we’ve been on the less pleasant side of it.
We’re still feeling the pressure.
When risk management is your top priority, it naturally limits how aggressive you can be.
That means passing on those violent gap-ups that feel impossible to chase, and it often means trimming or avoiding positions when the broader market still looks fragile, like it did through the end of March, when a deeper correction seemed not just possible, but likely.
The reality is, this approach can make you look… not great in the short term.
There’s a reason seasoned traders often say that good risk management can feel like stupidity in real time. You cut exposure, stay cautious, and then watch stocks rip without you.
It’s frustrating, and yes—right now, we do feel a bit like idiots.
But zoom out, and the logic still holds. The same discipline that keeps you out of extended moves is also what protects you when things truly break down.
It’s not designed to maximize every opportunity, but it’s designed to keep you in the game.
Right now, the market feels like it’s trying to find its footing again. What we’d really like to see is some proper consolidation: leaders cooling off, setting up clean structures, building those textbook flags that give you a defined, lower-risk entry.
Because that’s our moment.
When things tighten up, and the noise fades, that’s when we need to be fully locked in: ready to step in with more size, more conviction, and a clear plan.
Until then, patience isn’t just a virtue; it’s our strategy.
A quick update on TradeDeck
We’ve recently uploaded all trades from 2025 and 2026 into the platform. This gives us a much broader dataset to work with and will allow us to better personalize and improve the experience going forward.
One important note: the difference compared to last week’s performance is simply due to two trades opened in 2025 and closed at the beginning of 2026, which impacted the reported data.
If we exclude those two trades, our actual performance for 2026 is currently around 3%.
We apologize for any confusion this may have caused, but we’re actively working on the app and making significant improvements behind the scenes.

Here’s a look at this week’s market health, with a breakdown of index and sector performance.


We are currently developing an application.
It is not a generic solution for every market participant, but a platform built specifically for swing trading, momentum strategies, and short to medium-term investing.
If we see meaningful interest, we will open a limited number of testing spots and allow selected users to access the platform early.
As previously stated, all paid subscribers will receive full access to the platform at no additional cost.

Latest articles:


Each stock carries a risk badge: ⚠️ High | 📊 Medium | 🛡️ Low.
Based on volatility, float, technicals, and fundamentals. Size your positions accordingly.
📈 Free Setup: Make It Count
FUTU: Futu Holdings Limited ADR 🛡️
What they do: A digital financial services company
Why watch? Futu is one of those businesses that looks almost too good on paper, which is precisely why it has attracted skepticism alongside admiration. The company’s gross profit margin came in at 88.7% in the most recent quarter, a figure that reflects both the inherent scalability of a digital brokerage model and the pricing power that comes with a platform that clients find genuinely useful.
The most recent earnings cycle told a compelling story. Management exceeded its own guidance by 19% in 2025, funded accounts grew 40% year over year, and the company has set a target of adding 800,000 new funded accounts in 2026. These are not the metrics of a business struggling to find its footing. The balance sheet is equally impressive, with $130.5 billion in client assets and no long-term debt, giving the company significant financial flexibility.
Analyst sentiment has been shifting positively. Citigroup upgraded the stock to Buy, and Barclays initiated with an Overweight rating, while Allspring Global Investments increased its institutional stake. When multiple independent research teams and institutional allocators are moving in the same direction simultaneously, it tends to be worth paying attention.
The broader context matters here as well. Trying to add exposure to China-linked assets has been a contrarian but increasingly interesting trade to think about, and FUTU, with its international footprint and digital-first model, is among the higher-quality ways to express that view.
Technical Outlook: After losing roughly 30% of its value and trading sideways since August 2025, the stock found consistent support at the $153.00 level last week. The level was tested multiple times in the last weeks, both as resistance and now as support. A couple of additional sessions of sideways consolidation would be ideal before committing to a position, allowing the pattern to tighten further and improving the risk-reward on entry.


Why We Don’t Wait for Sunday
Markets don’t move on your schedule. The best low-risk entries don’t announce themselves politely and wait for the weekend newsletter.
They show up when they show up. And if you’re not positioned, you miss them.
Paid members get real-time alerts: exact entries, stops, position sizing, and the thesis behind every trade. The same information we use to manage our own capital.
Free members get just one pick on Sunday.
Does that sound like an edge to you?
What’s Inside Premium
Free Access to TradeDeck
Premium members get early access to TradeDeck, the trading platform we’re building. The value of the platform alone already exceeds the cost of the subscription.
Watchlist Elite (7-9 Stocks)
Each selection undergoes rigorous financial analysis, technical evaluation, and strategic assessment.
Full Portfolio Transparency
Every position we hold. Entry price. Current P&L. Stop level. Real money, real risk.
Real-Time Trade Alerts (Chat Access)
This is where the edge lives. Exact entries, stops, and position sizing. Real-time. No lag
Quick Picks (5 Names)
Additional setups that just missed our main criteria but are worth watching.
Chat Access
See our thought process in real time. Ask questions. Watch how we manage risk.
The Tools We Actually Use
Member discounts on TC2000, Fiscal.ai, and other platforms. Same tools, better pricing.
What Paid Members Say:

We’re entrepreneurs first, traders second. We’ve sat in the CEO chair. We know what real execution looks like and how to spot it.
€39/month or 299€/year. Less than one losing trade. Cancel anytime.
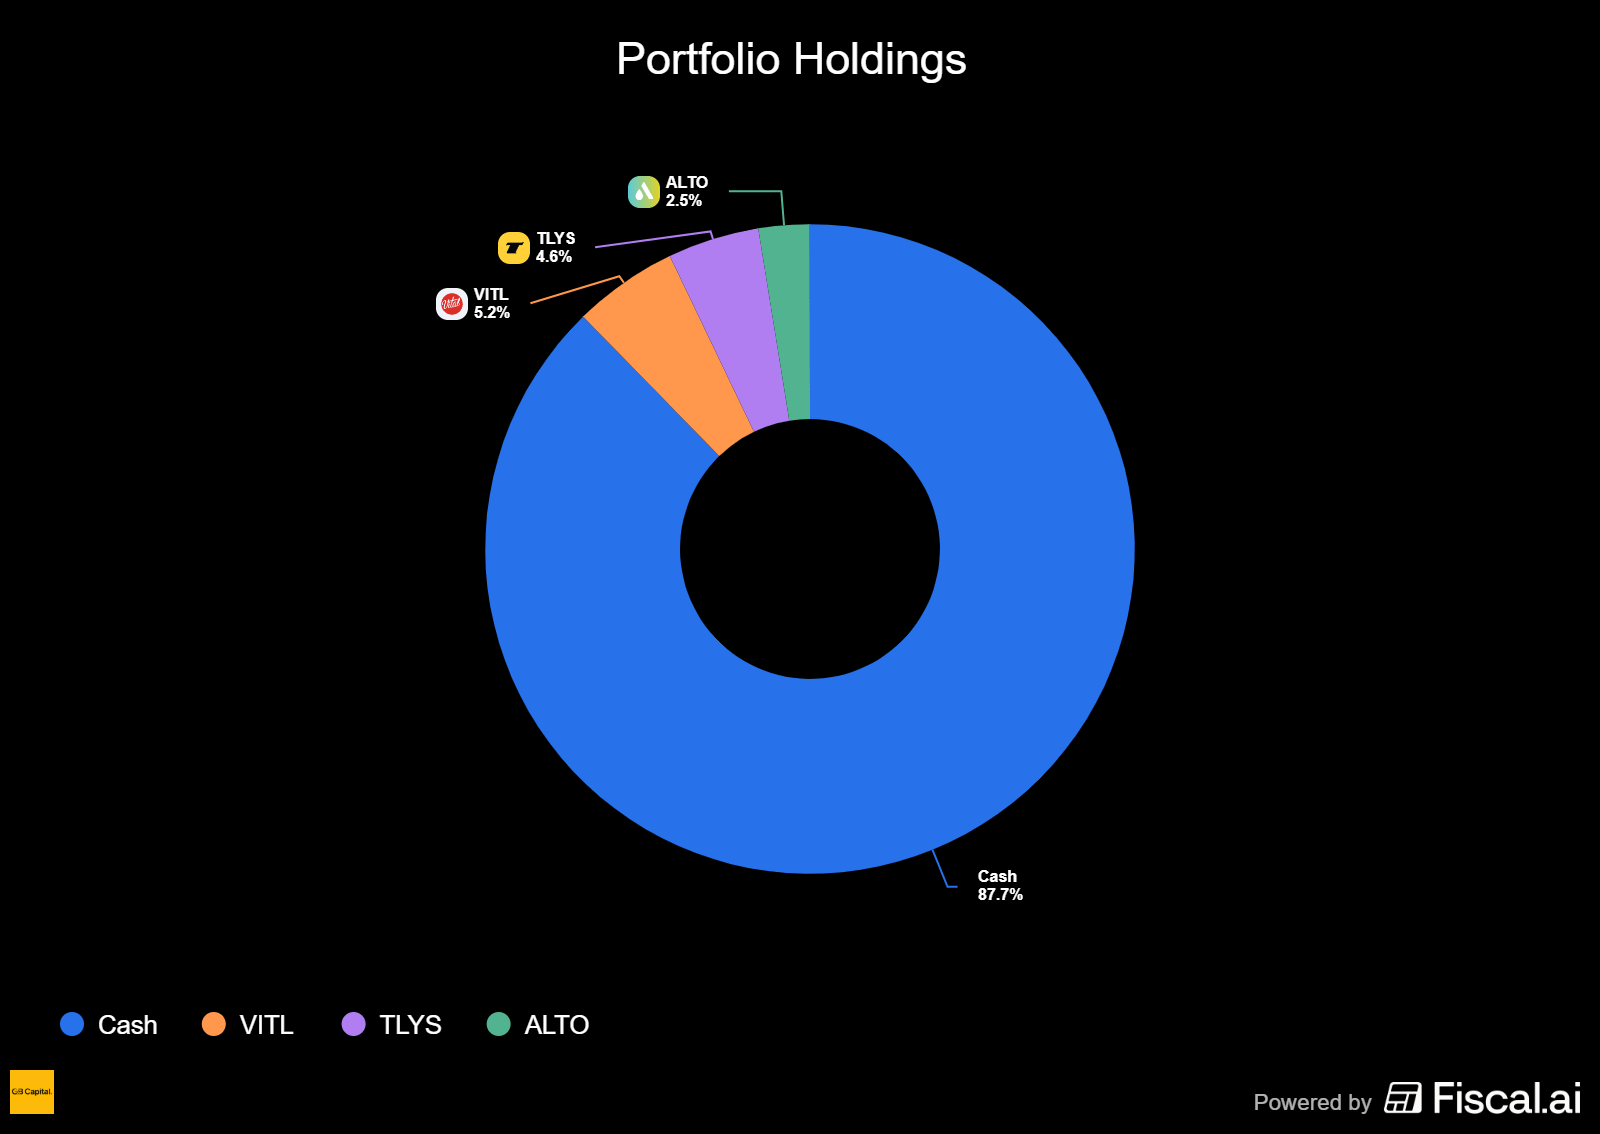
Portfolio updates and new positions:


💎📈 Watchlist Elite: Premium Market Movers
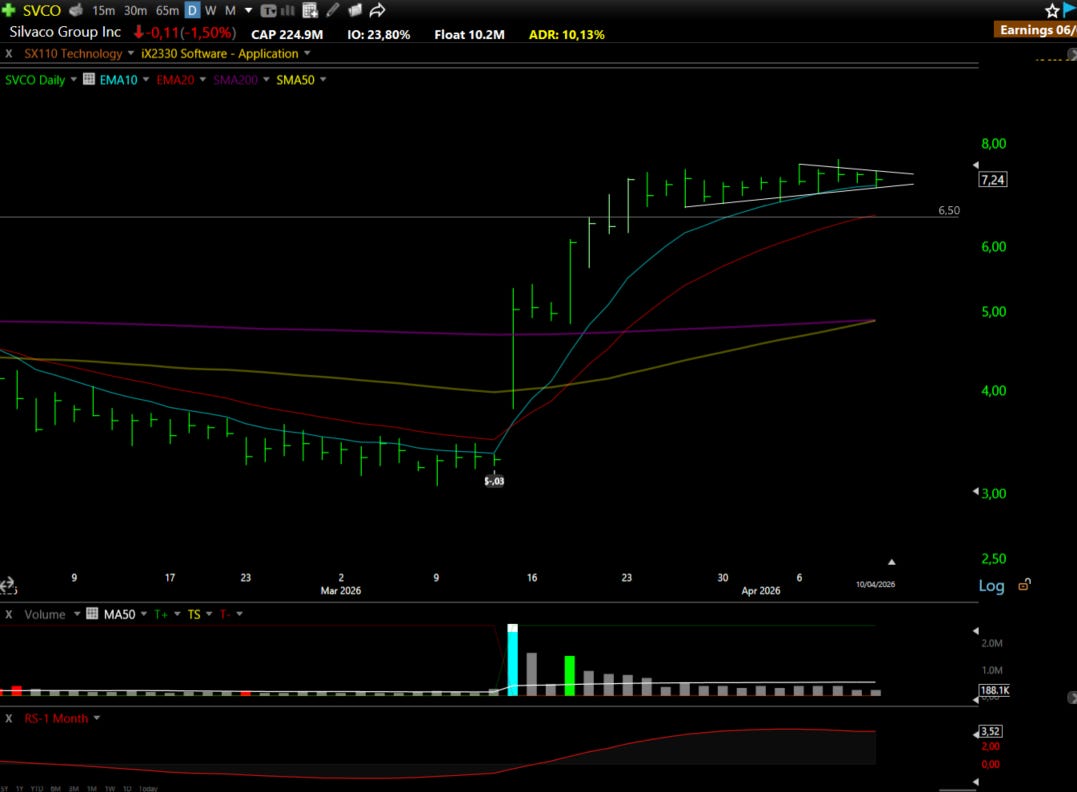
SVCO: Silvaco Group Inc ⚠️
What they do: A provider of specialized Electronic Design Automation (EDA) software
Why watch? Silvaco has long been overlooked by the broader market, often dismissed as a minor player in a sector dominated by giants. This assessment ignores the company’s critical role in the high-growth niches of silicon carbide and power electronics: technologies essential for the electric vehicle and AI infrastructure booms. The company recently solidified this positioning by expanding its strategic partnership with Taiwan’s Advanced Power Electronics Corp (APEC), which has integrated Silvaco’s design flows deep into its production of next-generation power devices.
The structural bull case here lies in the company’s FTCO platform, an AI-driven solution that optimizes fabrication processes. This product line is beginning to see meaningful adoption among major chip manufacturers, while its semiconductor IP business is providing the most immediate boost to the top line. The fourth quarter of 2025 served as a wake-up call for the market, as Silvaco delivered across-the-board beats. Bookings reached $18.3 million, hitting the high end of guidance, while revenue also outperformed expectations. Perhaps most impressive was the non-GAAP gross margin of 85.6%, a sequential improvement of 500 basis points that highlights the operating leverage inherent in their software-heavy model.
Technical Outlook: Following the earnings surprise, the stock surged 120% before entering its current consolidation phase. Critically, this pullback is occurring on significantly lower volume, suggesting that the initial buyers are not rushing for the exits and are instead waiting for the next leg higher. The stock found support at its 10-day exponential moving average last Thursday and has held steady since. With an initial price target of $10.00, traders can justify a position by risking roughly $0.50 to $0.60 to capture a potential $3.00 gain. This favorable risk-reward ratio, combined with a clear “change of character” in the price action, makes Silvaco one of the most interesting under-the-radar semiconductor plays currently available.
ASTS: AST SpaceMobile Inc⚠️
What they do: A technology company building the first space-based cellular broadband network
Why watch? The premise here is deceptively simple but technically extraordinary. Every other satellite internet solution on the market, including Starlink, requires either a ground station or a dedicated terminal to receive a signal. AST SpaceMobile has engineered a system where an ordinary LTE or 5G smartphone connects to an orbiting satellite exactly as it would to a cell tower on the ground. No special equipment, no new device, no subscription to a separate service.
What makes the business model particularly elegant is how AST has chosen to go to market. Rather than positioning itself as a competitor to existing mobile carriers, the company has built a wholesale partnership model that works alongside them. AST currently has agreements with more than 50 mobile network operators globally, giving it immediate access to a potential subscriber base exceeding 6 billion people without spending a dollar on consumer marketing. The customer acquisition cost is effectively zero, which is an almost unheard-of structural advantage in the telecommunications industry. Revenue flows in as a high-margin wholesale arrangement with the carriers, who then offer the service to their existing customers.
The economics of the satellite industry have also shifted meaningfully in recent years. The maturation of reusable heavy-lift rockets and the ability to manufacture and deploy large satellite arrays at scale have dramatically reduced the cost of building and maintaining a constellation. What would have been prohibitively expensive a decade ago is now commercially viable, and AST is benefiting from this structural tailwind.
There is also a thematic dimension worth considering. The space economy is increasingly capturing investor attention, and the anticipated IPO of SpaceX, whenever it materializes, is likely to act as a rising tide for the entire sector. AST SpaceMobile, as one of the few publicly traded pure-play space-based connectivity companies, stands to benefit from that renewed enthusiasm.
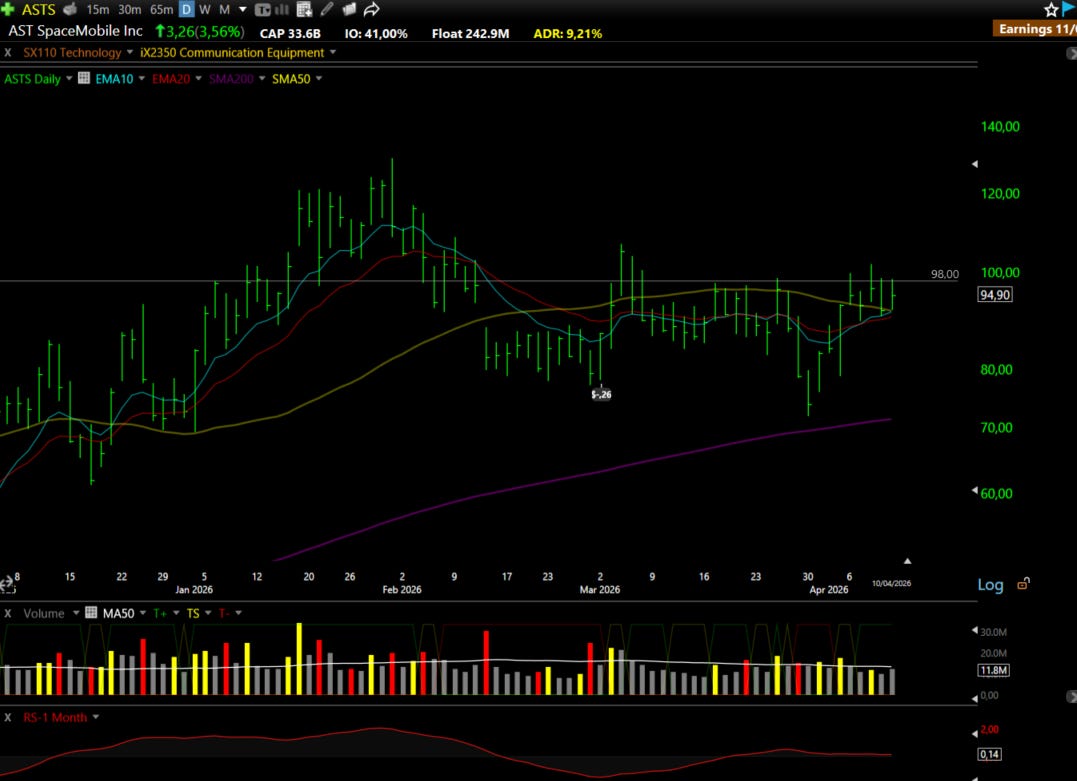
Technical Outlook: On the weekly chart, the stock has been consolidating since roughly September 2025, building a base that has grown increasingly significant with time. The $98.00 level has emerged as the critical line in the sand, having been tested and rejected at least three to four times over the past month and a half. Each failed breakout attempt is frustrating in the short term, but repeated tests of resistance without a breakdown below support are actually a constructive sign. It suggests buyers are absorbing supply rather than retreating. When a bullish market environment combines with a hot thematic catalyst and a clean break above that level, the stock has the potential to move toward all-time highs relatively quickly. Importantly, ASTS is not nearly as extended as many of its peers in the space theme, which means the risk-reward on a breakout is more favorable than it might appear at first glance.
NAVN: Navan Inc ⚠️
What they do: A technology company offering an AI-powered platform
Why watch? Navan has had a rough journey since going public, shedding more than 60% of its value from its IPO price. That kind of drawdown tends to scare away casual investors, but it also creates the conditions where genuinely good businesses can be found at compelling valuations, provided the underlying fundamentals are improving.
The most recent earnings report offered meaningful evidence that the business is gaining traction. Revenue grew 35% year over year to $194.9 million, but the more important detail is that this represented an acceleration of six percentage points compared to the 29% growth rate posted in the prior quarter. In a macro environment where corporate travel budgets are under scrutiny and enterprise software spending is being carefully managed, accelerating growth is a signal that Navan is winning market share rather than simply riding a favorable tide.
The competitive landscape includes well-established players like SAP’s Concur platform and Expensify, but Navan’s differentiation centers on the depth of its AI-driven automation and the comprehensiveness of its end-to-end platform. When a company embeds its software deeply into travel booking, payment processing, and expense reconciliation simultaneously, switching costs become substantial. Enterprises don’t change these systems lightly.
The analyst community has taken notice. Bank of America, Goldman Sachs, Oppenheimer, and Citigroup all carry Buy or Outperform ratings on the stock, with price targets ranging from $17 to $23. If the company can continue improving customer retention metrics while reducing the cost of its AI and inference infrastructure as a percentage of revenue, operating margins could expand faster than the market currently expects, potentially triggering a meaningful re-rating of the stock.
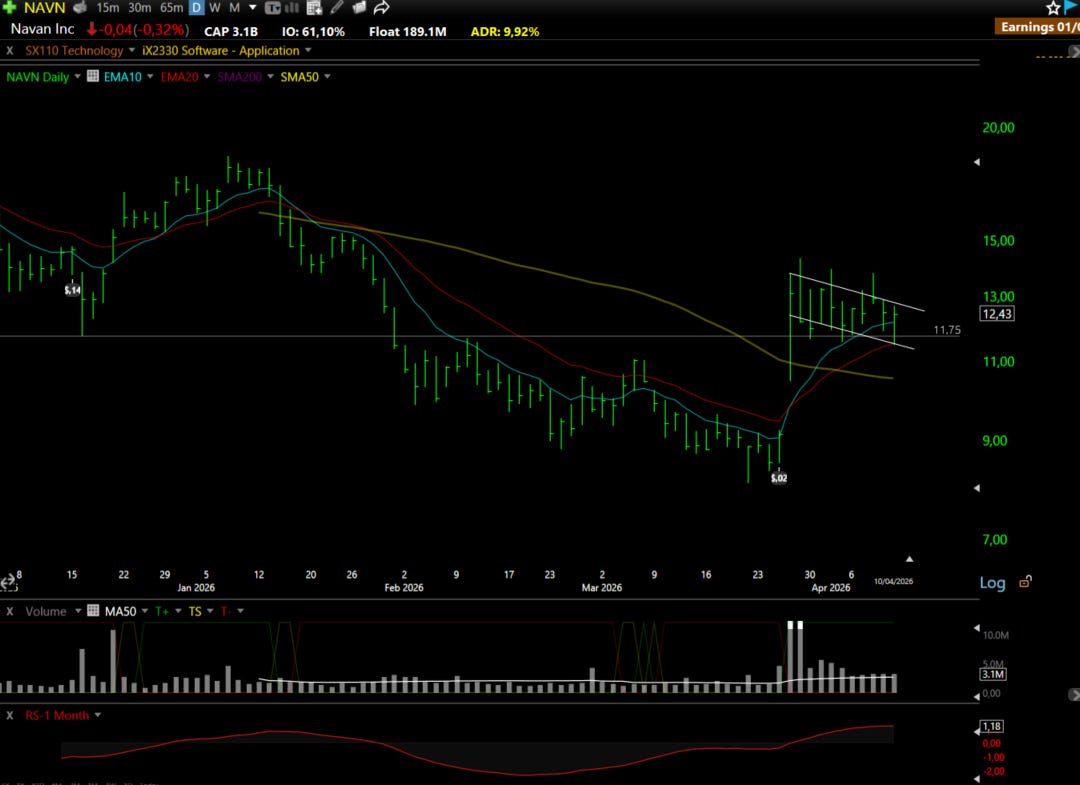
Technical Outlook: The daily chart is forming a clear flag pattern, with $11.75 serving as the primary support level. A flag is a continuation pattern where the stock consolidates in a tight, orderly range after a prior move, before resuming in the direction of the trend. The setup is there, but a word of caution: Navan’s price action is erratic, and the stock has a tendency to generate false signals that stop out traders before the real move begins. The cleanest entry comes on a confirmed break above $13.00, accompanied by above-average volume. More aggressive traders can look to enter on a break of the flag itself, but they should be prepared for the possibility of a shakeout and size their position accordingly. This is not a stock where tight stops work well.
DXYZ: Destiny Tech100 Inc ⚠️
What they do: A publicly traded closed-end fund that provides retail investors with access to a curated portfolio of late-stage private technology companies
Why watch? The honest answer here has less to do with traditional fundamental analysis and more to do with theme and timing. DXYZ is, at its core, a vehicle for gaining exposure to some of the most talked-about private companies in the world before they reach public markets.
SpaceX is the fund’s largest single holding, representing somewhere between 16% and 23% of the portfolio depending on the source and timing of the estimate. With articles about the SpaceX IPO growing louder by the month, DXYZ has emerged as the most liquid and accessible way for ordinary investors to participate in that story today. OpenAI represents approximately 6.9% of the portfolio through economic exposure to profit participation units. The company recently raised $122 billion in equity financing and has been reported to be targeting a late 2026 public listing. In February 2025, the fund added a $100 million position in Anthropic, the AI safety company behind the Claude family of models, which is reportedly targeting an IPO around October 2026. Databricks, valued at over $130 billion following its most recent funding round, rounds out the major positions at roughly 4% of the portfolio.
These are not obscure bets. Anthropic and Databricks are central players in the AI infrastructure buildout that has been driving some of the strongest stock performance in the market. SpaceX is the defining company of the commercial space era. For investors who watched data center-adjacent names like CRWV and NBIS perform strongly last week, DXYZ offers a way to position ahead of the next wave of that same thematic momentum.
Similar exposure can be found in VCX (Fundrise Innovation Fund) and RVI (Robinhood Ventures Fund I), but both carry lower liquidity and more volatile price action. DXYZ is the most practical choice among the three for active traders.
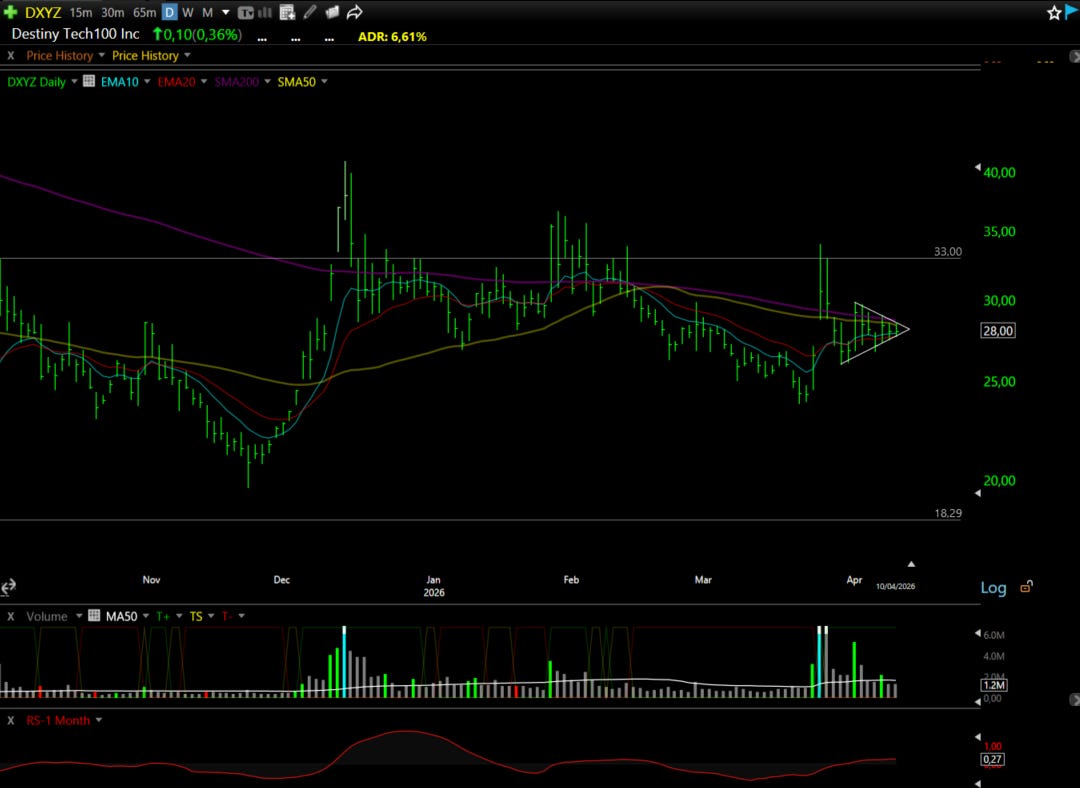
Technical Outlook: With a medium average daily range of around 6.5% and a recent close-to-close move of just 0.36%, the stock is in an unusually compressed state. That combination of a wide, typical range and a very tight recent range is exactly the kind of setup that precedes explosive moves. The risk-reward here is about as clean as it gets for a name with this kind of thematic firepower behind it.
YPF: YPF Sociedad Anónima 📊
What they do: Argentina's largest integrated energy company, with operations spanning oil and gas exploration, production, refining, and distribution
Why watch? The investment case for YPF is more layered than a simple bet on oil prices. Yes, a sustained move higher in Brent crude benefits the company’s earnings, but the more interesting thesis rests on three distinct pillars that exist largely independent of where oil trades on any given day.
The first is Argentina’s macroeconomic normalization. The country has been through a prolonged period of financial instability, currency controls, and elevated sovereign risk premiums. As those conditions gradually improve under the current administration’s reform agenda, the discount applied to Argentine assets should compress, creating valuation upside that has nothing to do with commodity prices.
The second pillar is operational execution in shale. YPF’s development of the Vaca Muerta formation, one of the largest shale reserves in the world, has been progressing steadily. Volume growth and margin improvement in this segment are driven by drilling efficiency and infrastructure investment, not by the price of oil.
The third, and most underappreciated, is long-term LNG export optionality. Argentina has the resource base to become a meaningful LNG exporter, and if that infrastructure comes together over the next decade, it represents a significant source of value that is not yet reflected in the stock’s current valuation.
The more immediate and tactical angle is geopolitical. If tensions in the Strait of Hormuz escalate or U.S.-Iran negotiations break down, oil prices could move sharply higher. In that scenario, investors seeking energy exposure would naturally gravitate toward producers insulated from direct conflict risk. YPF, operating entirely in South America, fits that profile. That said, this is a conditional trade. If the geopolitical situation stabilizes, the rationale weakens considerably, and the volatility of oil markets during periods of uncertainty is not something to take lightly. We would only pursue this setup if the situation deteriorates further.
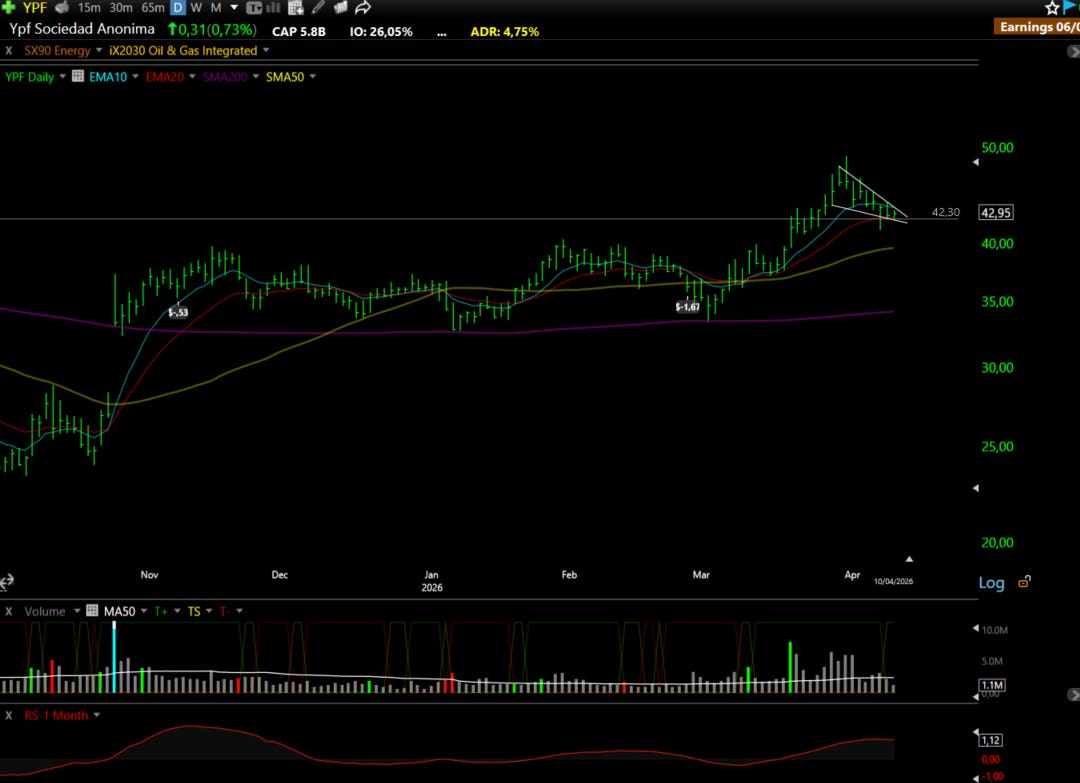
Technical Outlook: The stock is forming a clear bullish wedge near the $42.00 level, a price that has acted as both support and resistance on multiple occasions in recent months. A clean and sustained break above $43.50 would be the signal to watch, potentially opening the door to a new leg higher after a recent 15% decline in price. The setup is conditional on both the technical trigger and the macro backdrop aligning simultaneously.
CWST: Casella Waste Systems Inc 🛡️
What they do: A regional solid waste management company
Why watch? Waste management is rarely the most exciting sector to discuss, but Casella has quietly built one of the more compelling growth stories in the mid-cap space. The business is executing well across multiple fronts simultaneously, and after pulling back roughly 30% from its May 2025 peak, the valuation has reset to a level where the risk-reward looks genuinely attractive again.
The most recent quarter illustrated the consistency of the underlying business. Revenue came in at $469.1 million, representing 9.7% year-over-year growth. What’s worth noting is the composition of that growth: $23.1 million came from acquisitions and $18.5 million from same-store growth, meaning the organic business is expanding at a healthy clip even before the contribution from deals. Solid Waste revenue, the core of the business, grew 9.9% to $376 million, while the Resource Solutions segment added $93 million, up 9.1%.
The most important near-term catalyst, however, is the completion of the Mid-Atlantic integration. Earlier in the year, a delay in receiving 40 automated trucks created an operational bottleneck that weighed on margins. Those trucks have now arrived, and management expects the combination of the new fleet, labor efficiencies, and route optimization to generate more than $5 million in annual savings beginning in 2026. On an absolute dollar basis, that might sound modest, but in the context of Casella’s margin structure, it translates to approximately one full percentage point of adjusted EBITDA margin improvement. The company has historically operated with an adjusted EBITDA margin ceiling around 23%, and this operational unlock is one of the clearest paths to breaking through that threshold.
The acquisition strategy deserves equal attention. In 2025, Casella completed nine acquisitions representing approximately $115 million in annualized revenue, with an additional $30 million added through the Mountain State Waste deal. That $115 million figure represents roughly 7% growth relative to full-year 2024 revenue, sourced entirely through M&A rather than organic expansion. Perhaps more telling is the size of the pipeline: management has indicated it currently stands at over $500 million in annualized revenue, suggesting the acquisition runway remains substantial. In a fragmented regional industry like waste management, the ability to consistently identify, acquire, and integrate smaller operators is a durable competitive advantage that compounds over time.
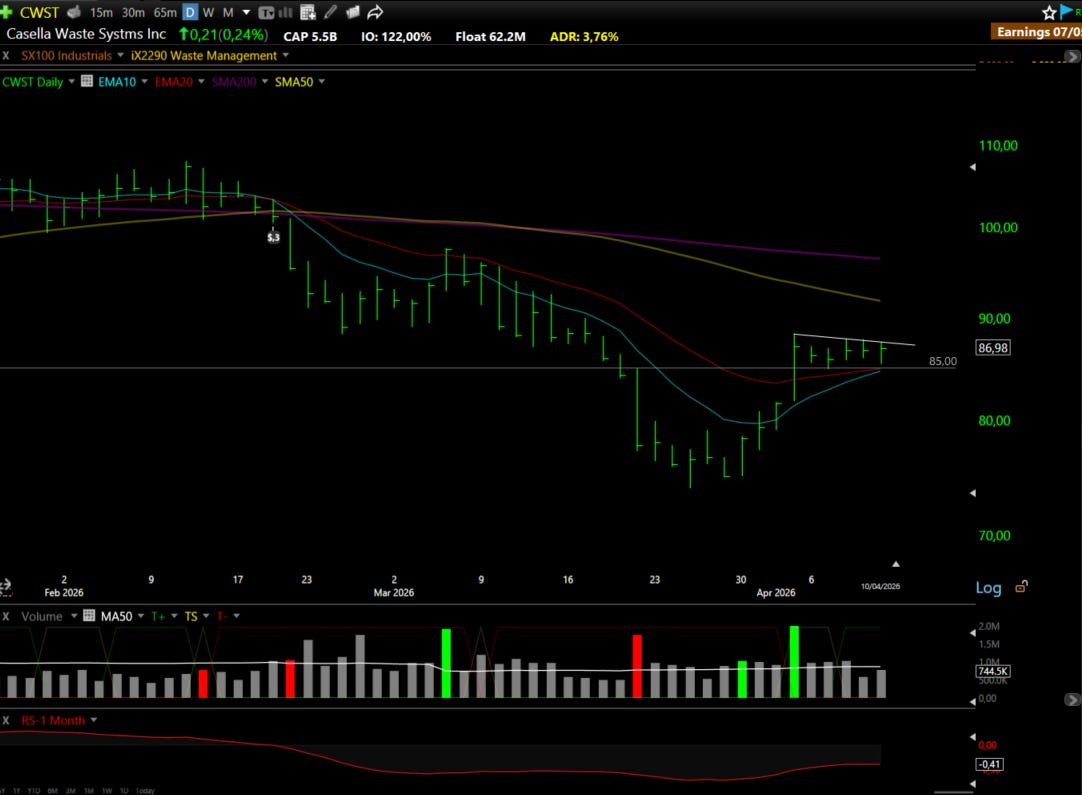
Technical Outlook: The stock carved out a bottom at $75.00 and surged toward $90.00 in just a couple of sessions, before pulling back in an orderly and constructive manner on declining volume. The 10-day and 20-day exponential moving averages have been providing consistent support throughout the pullback, which is exactly the behavior you want to see in a healthy consolidation. The pattern has the look of a textbook short handle forming after a cup base, and a clean break above $88.00 on meaningful volume would be the trigger for what could be a meaningful next leg higher. The low-volume nature of the current pullback is an encouraging sign that sellers are not in control and that the path of least resistance remains upward once the consolidation resolves.
These tickers below didn’t make the main cut, but they’re on our radar for a reason. We’ve vetted them; now you decide if they fit your game.
More opportunities, less noise.
⚡📋Scanned Stocks: Quick Picks
KOD - Kodiak Sciences Inc
FC -Franklin Covey Co
CBIO - Crescent Biopharma Inc
APEI - American Public Education Inc
JAGU - Jaguar Uranium Corp
“The markets are constantly in a state of uncertainty and flux.”
George Soros
Disclaimer: This analysis is for informational purposes only and should not be considered financial advice. Always conduct your research and consult with a licensed financial advisor before making investment decisions.