


The Hierarchy of Pain
Markets, like any organism under stress, reveal their true nature when the pressure’s on. And what we’re seeing now is a complete inversion of the natural order: the kind of thing that should make you sit up and pay attention, even if you’re half-drunk and exhausted.
Small caps (those scrappy, unloved bastards that usually get slaughtered first when things go sideways) are holding the line. Mid-caps trail behind, bruised but standing. Then comes the S&P 500, limping along in the middle of the pack like a wounded animal trying to keep up with the herd.
And bringing up the rear, bleeding out in real time? The Nasdaq. Your beloved tech darlings. The stocks everyone spent the last three years telling you were “the future.” They’re getting destroyed.
This isn’t how bull markets work. This is rotation. This is capital fleeing to safety. This is the market telling you something, if you’re sober enough to listen.
Our indicators (the ones we built, the ones we trust because we put our own money behind them) are screaming red. Not yellow. Not orange. Red.
As in: stop, look both ways, and for the love of God, don’t assume that because you didn’t die yesterday, you’re immortal today.
Digital assets had the kind of week that makes you question your life choices. Bitcoin broke support. Altcoins evaporated. The order books looked like a ghost town at 3 A.M.: nobody home, nobody buying, just the sound of wind whistling through empty streets.
Three things converged to create this perfect storm of misery:
The Warsh Effect. Kevin Warsh gets nominated for Fed Chair, and suddenly the speculative froth that’s been holding up crypto like a bad scaffolding starts to wobble. The market smells hawkishness. It smells tightening. It smells the end of free money. And crypto, that beautiful, ridiculous casino built entirely on liquidity and vibes, doesn’t do well when the punch bowl gets yanked.
ETF Exhaustion. Remember when institutional money was supposed to save us all? When were the ETFs going to bring legitimacy and stability? Yeah, about that. The flows reversed. The smart money that piled in during the euphoria is now heading for the exits, and they’re not looking back.
Thin Order Books. This is the part that should terrify you. When the whales decided to sell, there was nobody—nobody—on the other side to catch the knife. The bids disappeared. The market gapped down like a trapdoor opening beneath your feet. This is what happens when liquidity is an illusion, when everyone’s long and nobody wants to be the bagholder.
You want to know where the real players are positioning? Look at the sector leaderboard. It’s not sexy. It’s not going to get you invited to cocktail parties in the Hamptons. But it’s honest.
Basic Materials. Consumer Defensive. Energy.
These are the sectors you rotate into when you're scared. When you want tangible value. When you want something real that you can touch, something that won't evaporate if the narrative shifts.
When you want things that exist in the physical world and generate cash flow regardless of whether some venture capitalist thinks they're "disruptive."
There’s a Taoist principle that applies here: flow with the current, not against it. Fighting the tape is how you get your face ripped off. Ego is expensive. Stubbornness is a luxury we can’t afford.
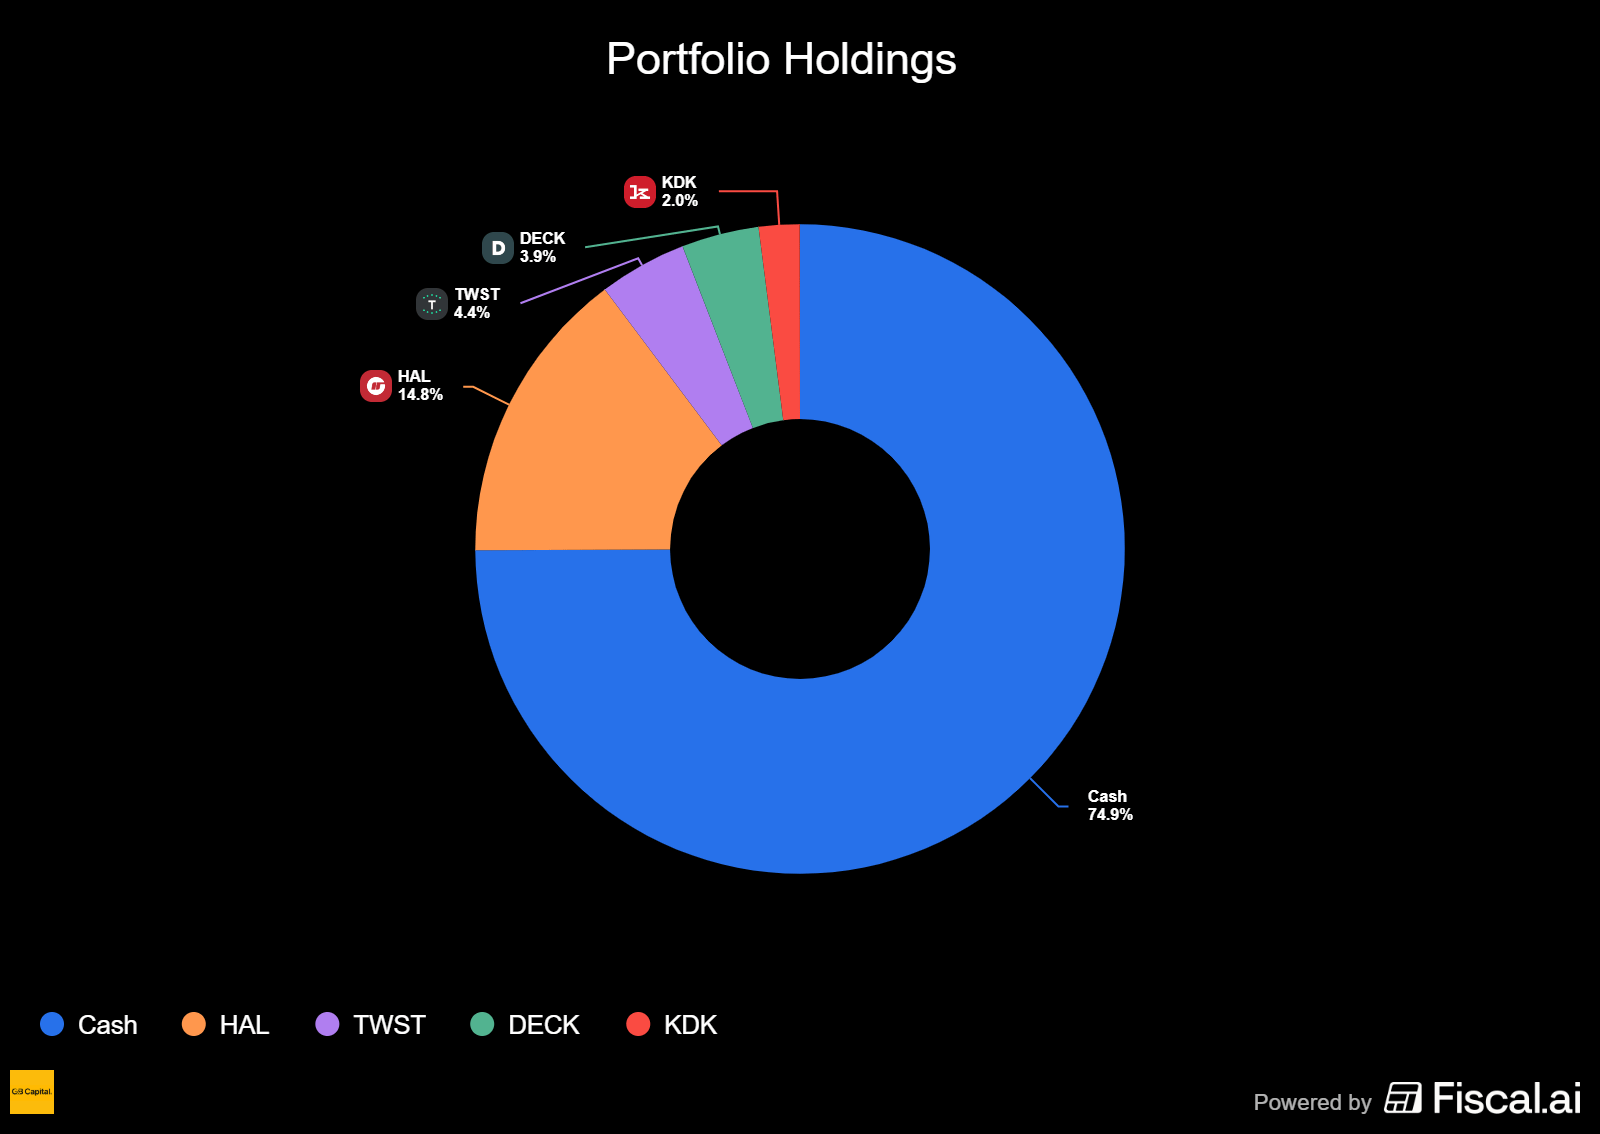
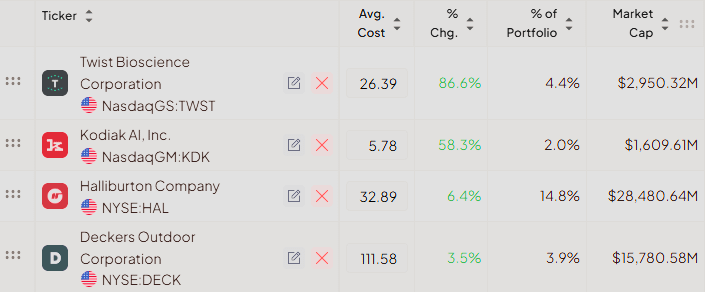
Last week, we made moves. We exited high-beta, speculative positions that lost momentum. We don’t marry our trades. We don’t fall in love. When the chart breaks, we leave. No drama. No second-guessing. Just execution.
We entered two new positions in Oil & Gas and Consumer Cyclicals.
Not AI. Not data centers. Not the shiny objects everyone’s chasing. We’re following relative strength. We’re going where the money is actually flowing, not where we wish it was flowing.
Are these positions exciting? No. Will they make for good dinner conversation? Absolutely not.
Friday’s chaos (that violent, whipsaw action) destroyed a lot of clean setups. The risk/reward ratios are garbage now. Everything’s messy. The charts look like a crime scene.
We could throw out a laundry list of mediocre ideas, half-baked setups with dubious outcomes. We could fill the space.
We could give you something to do, just so you feel busy.
Sometimes the smartest thing you can do is sit on your hands, watch the tape, and wait for the market to give you something clean.


Latest articles:


Each stock carries a risk badge: ⚠️ High | 📊 Medium | 🛡️ Low.
Based on volatility, float, technicals, and fundamentals. Size your positions accordingly.
📈 Free Setup: Make It Count
ENPH: Enphase Energy 📊
What they do: A leading provider of microinverter-based solar energy systems
Why watch? Enphase recently reported fourth-quarter results that exceeded Wall Street expectations on both revenue and profitability, providing a welcome positive surprise in a sector that has faced significant headwinds over the past few years. While the company’s European business continues to struggle(sales declined to multi-year lows), the core U.S. market showed encouraging signs of stabilization and growth.
The domestic business experienced solid demand, with sell-through (actual end-customer purchases, not just shipments to distributors) increasing more than 20% sequentially to reach the highest level in over two years. This is a meaningful data point because it suggests genuine end-market demand rather than channel stuffing. Management attributed the strength to several factors: safe harbor shipments (customers accelerating purchases ahead of potential policy changes), innovative financing solutions that make solar more accessible to homeowners, new product introductions, rising electricity prices that improve the economics of solar adoption, and the anticipation of lower interest rates, which reduce the cost of financing solar installations.
Looking ahead, the broader energy landscape is evolving in ways that could benefit solar companies. The explosive growth of artificial intelligence is driving unprecedented demand for electricity to power data centers. This structural shift is creating urgency around expanding energy capacity, and solar is positioned as a key component of that expansion. If this thesis plays out, the entire solar sector could see sustained tailwinds throughout 2026 and beyond.
Adding to the bullish case, Enphase’s CEO made a notable insider purchase on February 5, 2026, acquiring approximately $250,000 worth of shares. While insider buying doesn’t guarantee future performance, it does signal management’s confidence in the company’s prospects: executives typically don’t deploy personal capital unless they believe the risk-reward is favorable.
Technical Outlook: The stock experienced its highest volume day on the earnings announcement (nearly five times the normal daily average, purple volume bar), indicating significant institutional interest. The gap-up from earnings has established $47.50 as a key support level, while $51.50 represents the immediate resistance to watch. Currently, the stock is somewhat extended from its moving averages, suggesting that a brief consolidation period would be healthy before the next leg higher. Ideally, we’d like to see a couple of additional days of sideways price action with declining volume; a 50% reduction in the average daily range would create a lower-risk entry point with tighter stop-loss parameters. Patience here could be rewarded with a more favorable setup.

Why We Don’t Wait for Sunday
Markets don’t move on your schedule. The best low-risk entries don’t announce themselves politely and wait for the weekend newsletter.
They show up when they show up. And if you’re not positioned, you miss them.
Paid members get real-time alerts: exact entries, stops, position sizing, and the thesis behind every trade. The same information we use to manage our own capital.
Free members get just one pick on Sunday.
Does that sound like an edge to you?
What’s Inside Premium
📊 Watchlist Elite (7-9 Stocks)
Each selection undergoes rigorous financial analysis, technical evaluation, and strategic assessment.
💼 Full Portfolio Transparency
Every position we hold. Entry price. Current P&L. Stop level. Real money, real risk.
⚡ Real-Time Trade Alerts (Chat Access)
This is where the edge lives. Exact entries, stops, and position sizing. Real-time. No lag
🎯 Quick Picks (5 Names)
Additional setups that just missed our main criteria but are worth watching.
💬 Chat Access
See our thought process in real time. Ask questions. Watch how we manage risk.
🛠️ The Tools We Actually Use
Member discounts on TC2000, Fiscal.ai, and other platforms. Same tools, better pricing.
What Paid Members Say:

We’re entrepreneurs first, traders second. We’ve sat in the CEO chair. We know what real execution looks like and how to spot it.
€39/month or 299€/year. Less than one losing trade. Cancel anytime.
Portfolio updates and new positions:

⚡ AI-optimized, human-verified: Our expert team carefully selected Premium market intelligence from Fiscal.ai data. Explore now →
💎📈 Watchlist Elite: Premium Market Movers
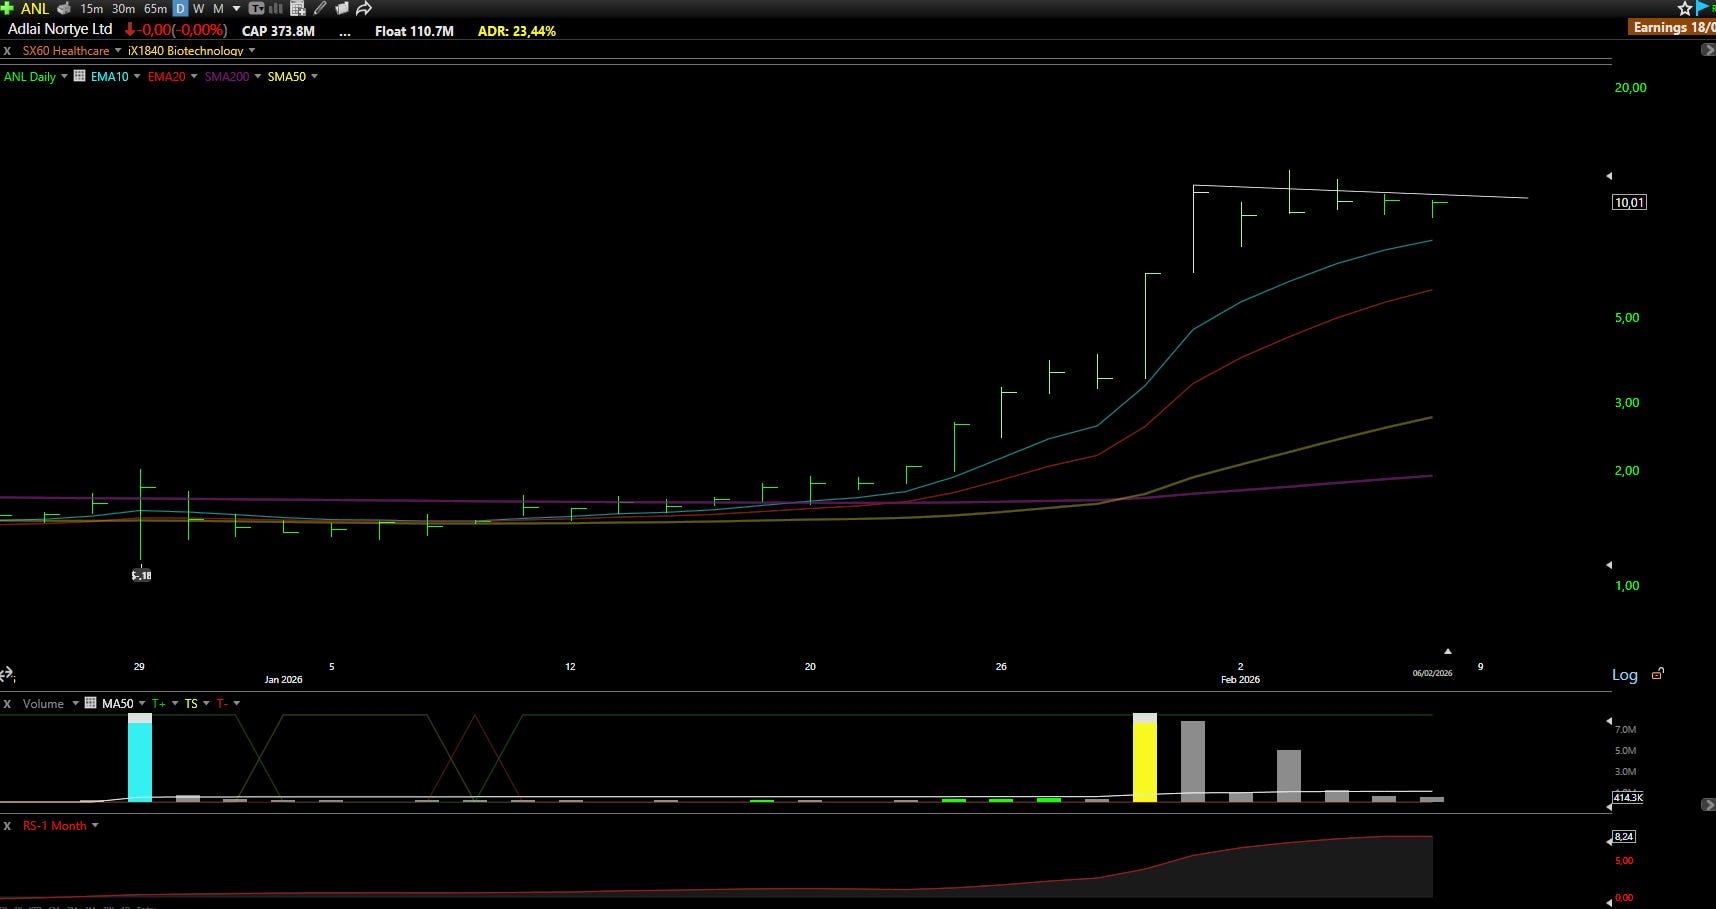
ANL: Adlai Nortye Ltd ⚠️
What they do: A clinical-stage biopharmaceutical company developing targeted oncology therapies, with a focus on pan-RAS inhibitors for difficult-to-treat cancers.
Why watch? The biotech sector has seen renewed interest in RAS-targeted therapies following recent clinical successes in the space. For context, we recently covered Erasca (ERAS) in last week’s watchlist, a company pursuing a similar therapeutic approach. Adlai Nortye is working on comparable science but trades at roughly one-tenth of ERAS’s market capitalization, presenting an intriguing risk-reward dynamic.
The company recently secured a significant vote of confidence from institutional investors, closing a $140 million private placement at $6.50 per share. The investor roster reads like a who’s-who of sophisticated healthcare-focused funds: Cormorant Asset Management, Columbia Threadneedle, Balyasny Asset Management, Point72, and Casdin Capital all participated. For those unfamiliar with these names, these are battle-tested institutional investors with deep expertise in evaluating biotech opportunities: their involvement suggests serious due diligence has been conducted on the underlying science.
The company’s lead asset, AN9025, is a pan-RAS inhibitor that has attracted attention from analysts. Lucid Capital recently initiated coverage with a Buy rating and an $11 price target, citing the potential for significant value creation as clinical data continues to de-risk the asset. While preclinical data appear competitive (potentially best-in-class according to some observers), it’s important to remember that early-stage data doesn’t always translate to clinical success. The path from promising lab results to approved therapy is long and fraught with failure points.
The elephant in the room: Adlai Nortye is a Chinese-domiciled company, which introduces an additional layer of risk that investors must carefully consider. Concerns about accounting transparency, regulatory oversight, and geopolitical tensions have historically weighed on Chinese-listed companies. However, the caliber of institutional investors backing this financing round provides some measure of comfort.
Technical Outlook: The stock is forming a tight flag pattern on progressively declining volume. The average daily range has compressed by nearly half over the past two trading sessions, suggesting accumulation. Support appears solid around the $9.00 level, which has held on multiple tests. While the setup looks good, an additional two to three days of consolidation, or even a final shakeout to test support, would create an even more favorable entry point with tighter risk. This is among the most compressed technical setups in the small-cap biotech space right now, but given the inherent volatility, position sizing should be conservative.
IBRX: ImmunityBio Inc ⚠️
What they do: A clinical-stage immunotherapy company
Why watch? ImmunityBio’s flagship product, ANKTIVA, represents a genuinely novel approach to cancer treatment. In technical terms, it’s a first-in-class IL-15 receptor superagonist: essentially a specially engineered protein complex designed to activate specific immune cells (natural killer cells and T cells) that attack tumors. Think of it as a therapy that supercharges the body’s own cancer-fighting machinery.
ANKTIVA received FDA approval in April 2024 for a specific type of bladder cancer called BCG-unresponsive non-muscle invasive bladder cancer (NMIBC). This is a significant unmet medical need; patients in this category have exhausted standard treatment options and face limited alternatives. The approval marked an important milestone, transforming ImmunityBio from a purely clinical-stage company to one with commercial revenues.
The revenue trajectory tells an interesting story. In the first three quarters of 2024, the company reported product revenues of $74.7 million. Management recently disclosed preliminary fourth-quarter revenues of $38.3 million, bringing the full-year total to approximately $113 million, representing roughly 700% year-over-year growth. While that headline number sounds impressive, the sequential quarterly growth of just 20% suggests the initial launch momentum may be moderating. Unit sales volume growth of 750% year-over-year provides additional context, indicating that price isn’t driving the revenue expansion; actual patient adoption is.
Recent positive developments include regulatory approval in Saudi Arabia, not only for bladder cancer but also for metastatic non-small cell lung cancer (NSCLC). This represents the first approval for ANKTIVA in lung cancer and the first approval of a subcutaneous formulation, which could improve patient convenience and adoption. International expansion and label expansion are critical growth drivers for any single-product company.
However, the financial picture requires scrutiny. ImmunityBio’s accumulated deficit now exceeds $3 billion: a staggering figure that reflects years of cash burn during development. The company reported a nine-month net loss in 2024 of over $250 million against the same cash position. This raises fundamental questions about the path to profitability and the potential need for additional capital raises, which would dilute existing shareholders. The company’s founder has historically provided financial support, but investors should not assume this will continue indefinitely.
Given these uncertainties, we’ll focus on what the chart is telling us rather than attempting to forecast the company’s long-term financial viability.
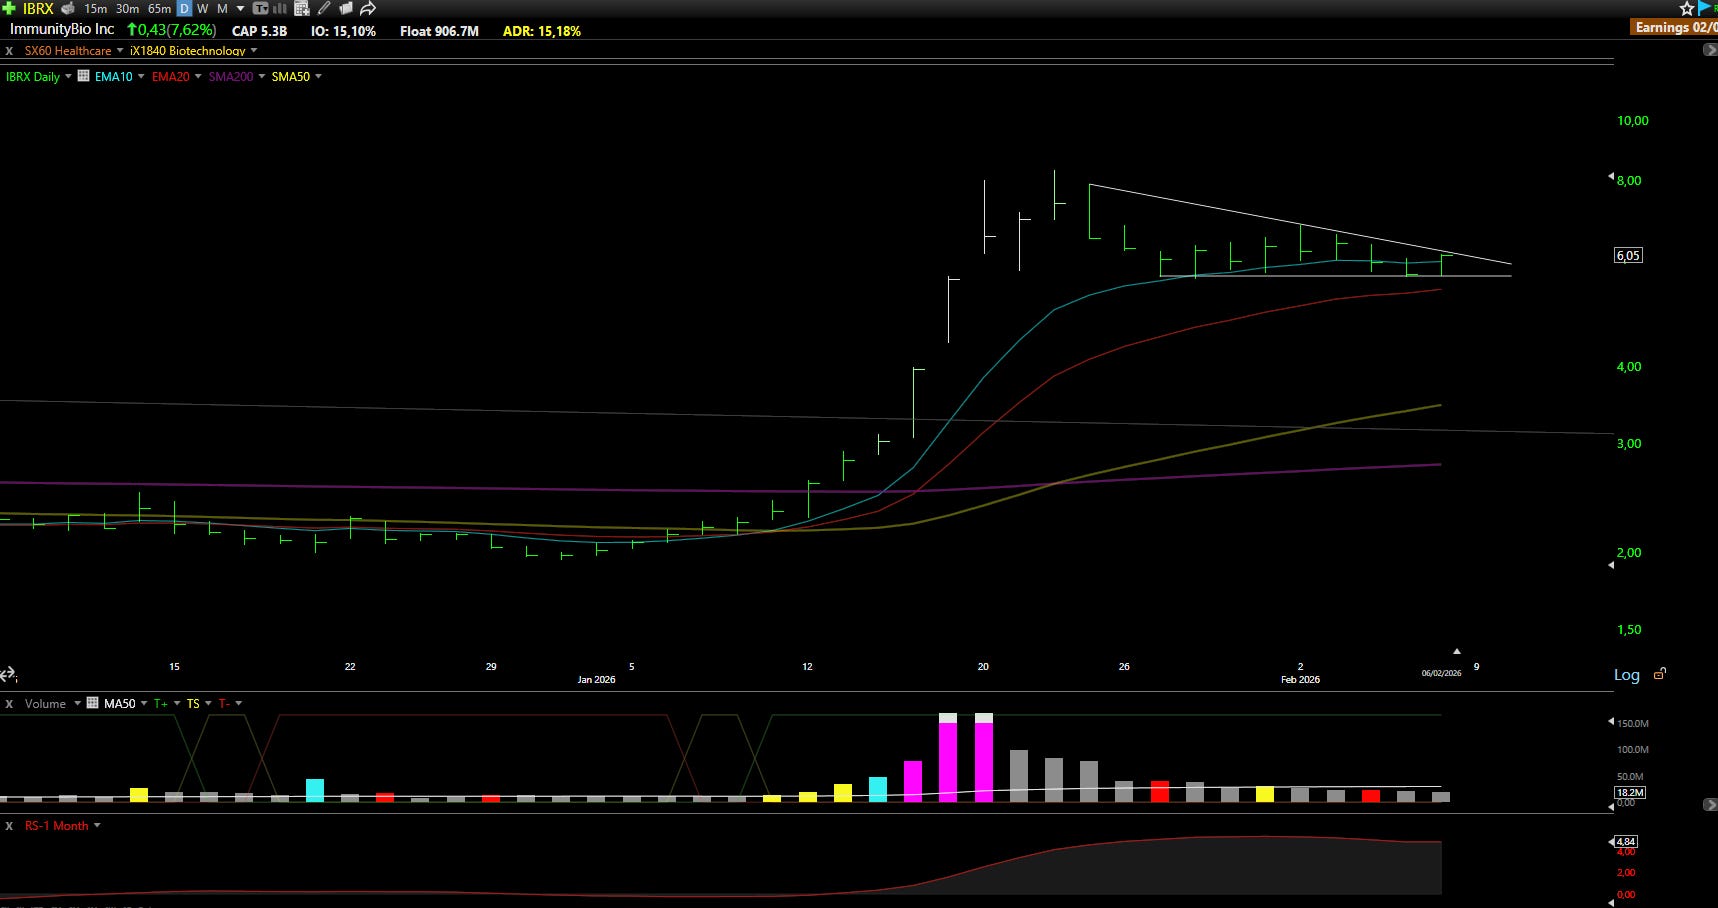
Technical Outlook: The stock has retraced approximately 30% from recent highs and is now finding support at the 10-day exponential moving average, with the 20-day EMA not far below. This represents the first significant falling wedge pattern since the initial explosive move higher: a gain of over 300% that occurred on the highest volume in the stock’s history, with three consecutive days of exceptional trading activity (purple volume bars). The white bars on the price chart signal extreme overextension at the peak, and the subsequent pullback has brought the stock back to more reasonable technical levels. Currently, the average daily range has compressed to roughly half its recent norm, indicating the pattern is tightening and potentially nearing a resolution. The setup looks increasingly explosive and appears close to ready. The key support level to monitor is $5.50: a break below this level would invalidate the constructive setup and suggest further downside.

Put the market on autopilot, experience the Best Platform with TC2000
Explore now →
AAON: AAON Inc 📊
What they do: A manufacturer of HVAC solutions for commercial and industrial applications
Why watch? For investors who followed last week’s watchlist, we covered Watsco (WSO), another company in the HVAC space. AAON operates in a similar industry but with a different business model and growth profile. The company has a solid track record of growing revenues, profits, and cash flows, and operates through three distinct business segments.
The first segment focuses on semi-custom and custom HVAC systems, along with control solutions and aftermarket parts: this is the traditional bread-and-butter business. The second segment also produces semi-custom and custom HVAC systems, in addition to specialized heating and cooling coils used in these systems. While these two segments provide stable cash flow, the real excitement centers on the third segment: BASX.
BASX specializes in high-performance cooling systems designed specifically for hyperscale data centers. These facilities generate enormous amounts of heat and require sophisticated cooling solutions to maintain optimal operating temperatures. As AI adoption accelerates, the demand for data center capacity (and the cooling systems that support it) is growing exponentially.
This positions AAON as what some might call a “low-risk” AI play. Rather than betting on which AI software company will win, investors can gain exposure to the infrastructure buildout that must occur regardless of which specific AI applications succeed. If you believe data centers and adjacent industries will continue expanding, AAON’s BASX segment should be a significant growth driver in the coming years.
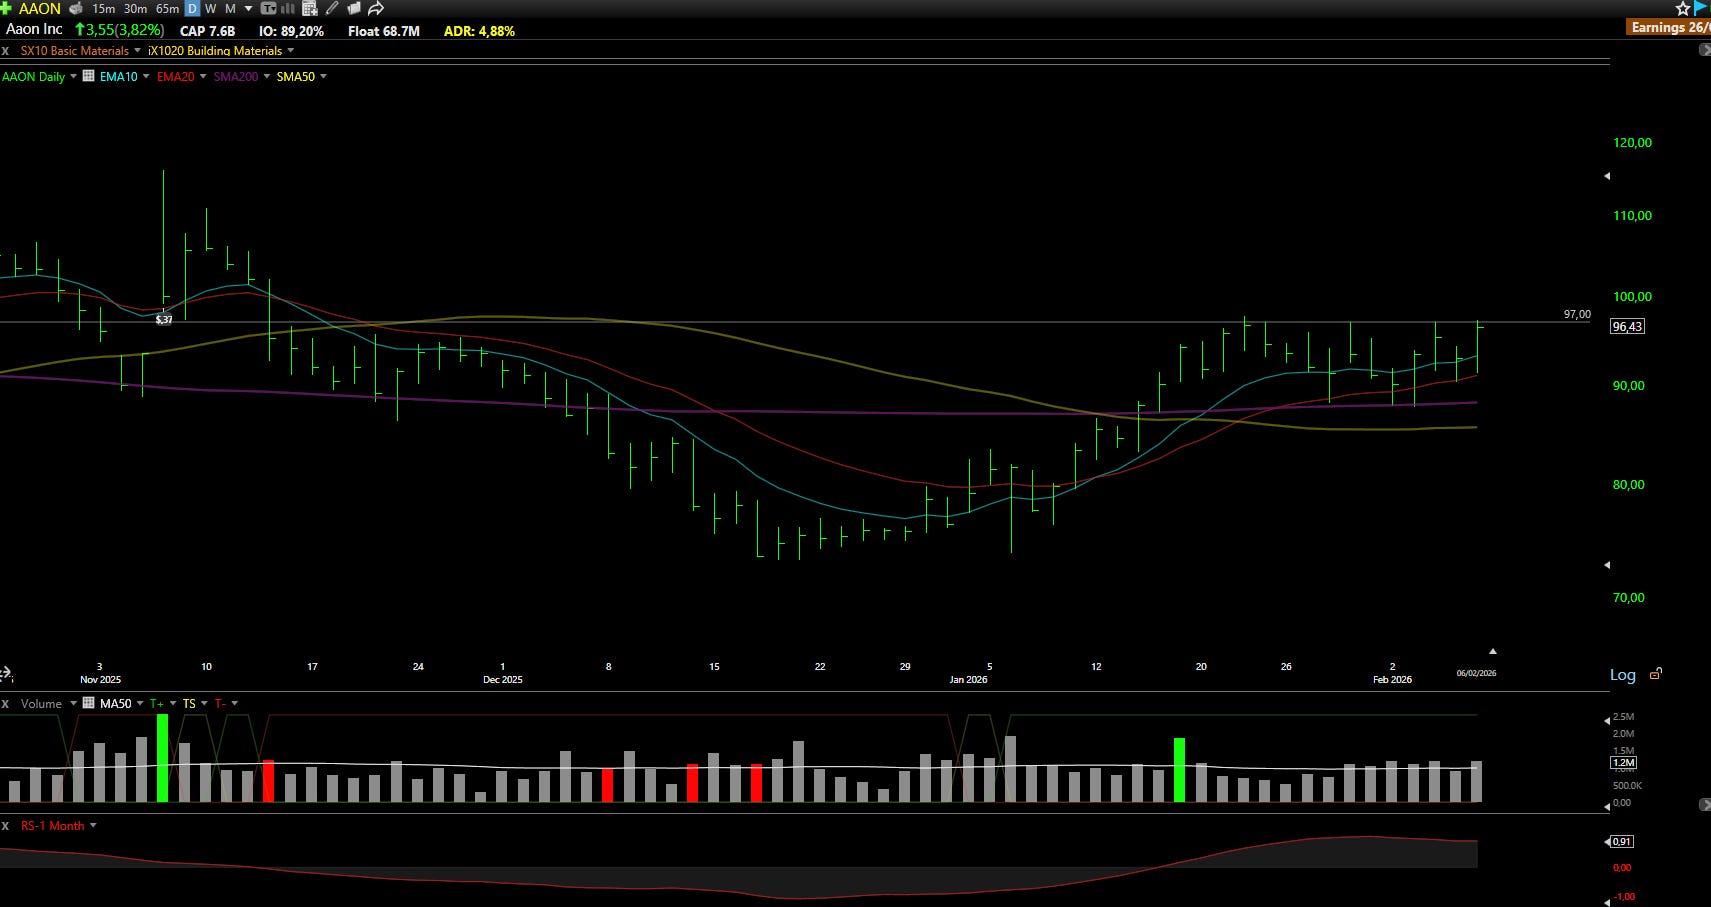
Technical Outlook: The stock has completed a textbook cup pattern and is now working on forming the handle. The key level to watch is $97.00, which represents the line in the sand for this pattern. However, there’s a caveat: the stock trades with relatively low liquidity, which creates choppy, whippy price action. From the primary support level at $88.00 to the resistance at $97.00, there’s a 10% distance: wider than ideal for a tight risk-reward setup.
Traders have two options: wait for a clean break above $97.00 with a stop-loss positioned below the most recent daily low (or the previous day’s low to tighten the risk), or be patient for a better entry. The lack of liquidity means you’ll need to be comfortable with volatility and potentially wider stops than you’d use on a more liquid name. Position sizing should account for this increased risk.
MOS: The Mosaic Company 🛡️
What they do: One of the world's largest producers of concentrated phosphate and potash fertilizers
Why watch? The fertilizers it produces are fundamental to securing crop yields and maintaining the global food supply chain. Without these products, we couldn’t use land as efficiently or achieve the reliable harvests that feed billions of people.
However, Mosaic operates in a notoriously cyclical industry where spot commodity prices drive earnings volatility. The company’s capital-intensive phosphate business has been pushing cash flows into negative territory recently, and with increasingly restrictive global trade policies creating uncertainty, many fundamental analysts are cautious about cyclical businesses like this. The valuation appears dirt-cheap compared to both sector peers and Mosaic’s historical average, but value traps exist for a reason: sometimes cheap stocks get cheaper.
That said, the chart is telling a different story than the fundamentals might suggest.
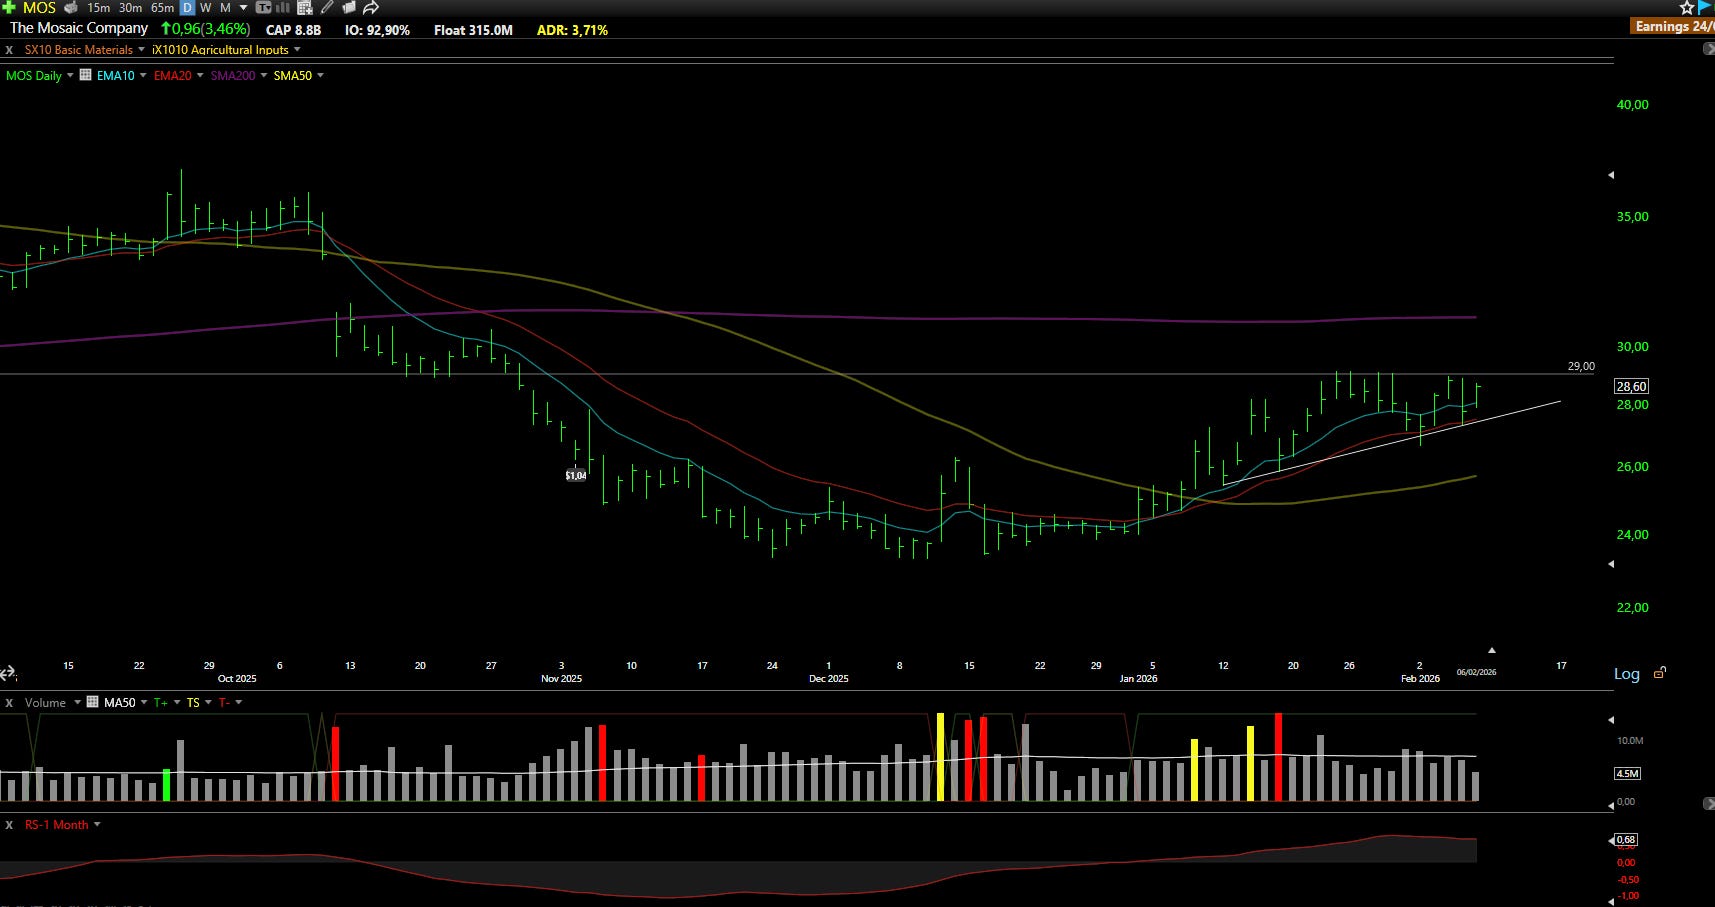
Technical Outlook: Since November 2025, the stock has been forming a clear saucer-with-handle pattern. The price has now moved above the key moving averages (the 10-day and 20-day exponential moving averages, as well as the 50-day simple moving average) and has been “surfing” the 10-day and 20-day EMAs nicely, with these averages providing consistent support on pullbacks.
The current key level to watch is $29.00. For the ideal setup, we’d like to see one to two additional inside days (days where the trading range is contained within the previous day’s range) accompanied by further volume contraction. This would indicate that sellers are exhausted and the stock is coiling for the next move.
It’s also worth considering broader market rotation dynamics. After years of underperformance, beaten-down sectors like materials and agriculture could finally attract capital if investors begin rotating out of expensive growth stocks and into cheaper, unloved areas of the market. Mosaic could benefit from this shift in sentiment, regardless of near-term fundamental concerns.
NAUT: Nautilus Biotechnology Inc ⚠️
What they do: A life sciences company developing a next-generation proteomics platform
Why watch? Nautilus is addressing one of the most significant bottlenecks in modern biology. Despite proteins being the primary drivers of disease and the targets of most drugs, existing technologies produce incomplete, biased, and low-quality data. This limitation has slowed progress in understanding and treating complex diseases like Alzheimer’s, cancer, and cardiovascular disease.
The company’s proprietary Iterative Mapping technology takes a fundamentally different approach: it analyzes billions of intact single protein molecules simultaneously and converts complex biological signals into simple, AI-ready protein counts. This enables researchers to study entire protein networks and detect subtle disease-relevant changes that were previously invisible with conventional methods.
For the average investor, think of it this way: genomics (studying DNA) has been revolutionized over the past two decades, becoming faster, cheaper, and more accessible. Proteomics (studying proteins) is now undergoing a similar transformation, and Nautilus is positioning itself as a potential leader in this next wave. The company has strong scientific differentiation, robust intellectual property, and is focused on generating the high-quality data needed to enable AI-driven drug discovery, a theme that aligns with broader trends in biotech.
The addressable market is large and growing, but execution risks are substantial. Nautilus is still in the early stages of commercialization, moving from early access programs toward full market launch. The most recent significant news came in November 2025, when the company reported successful installation and testing of its first field evaluation unit at the Buck Institute for Research on Aging, a positive milestone, but still early days.
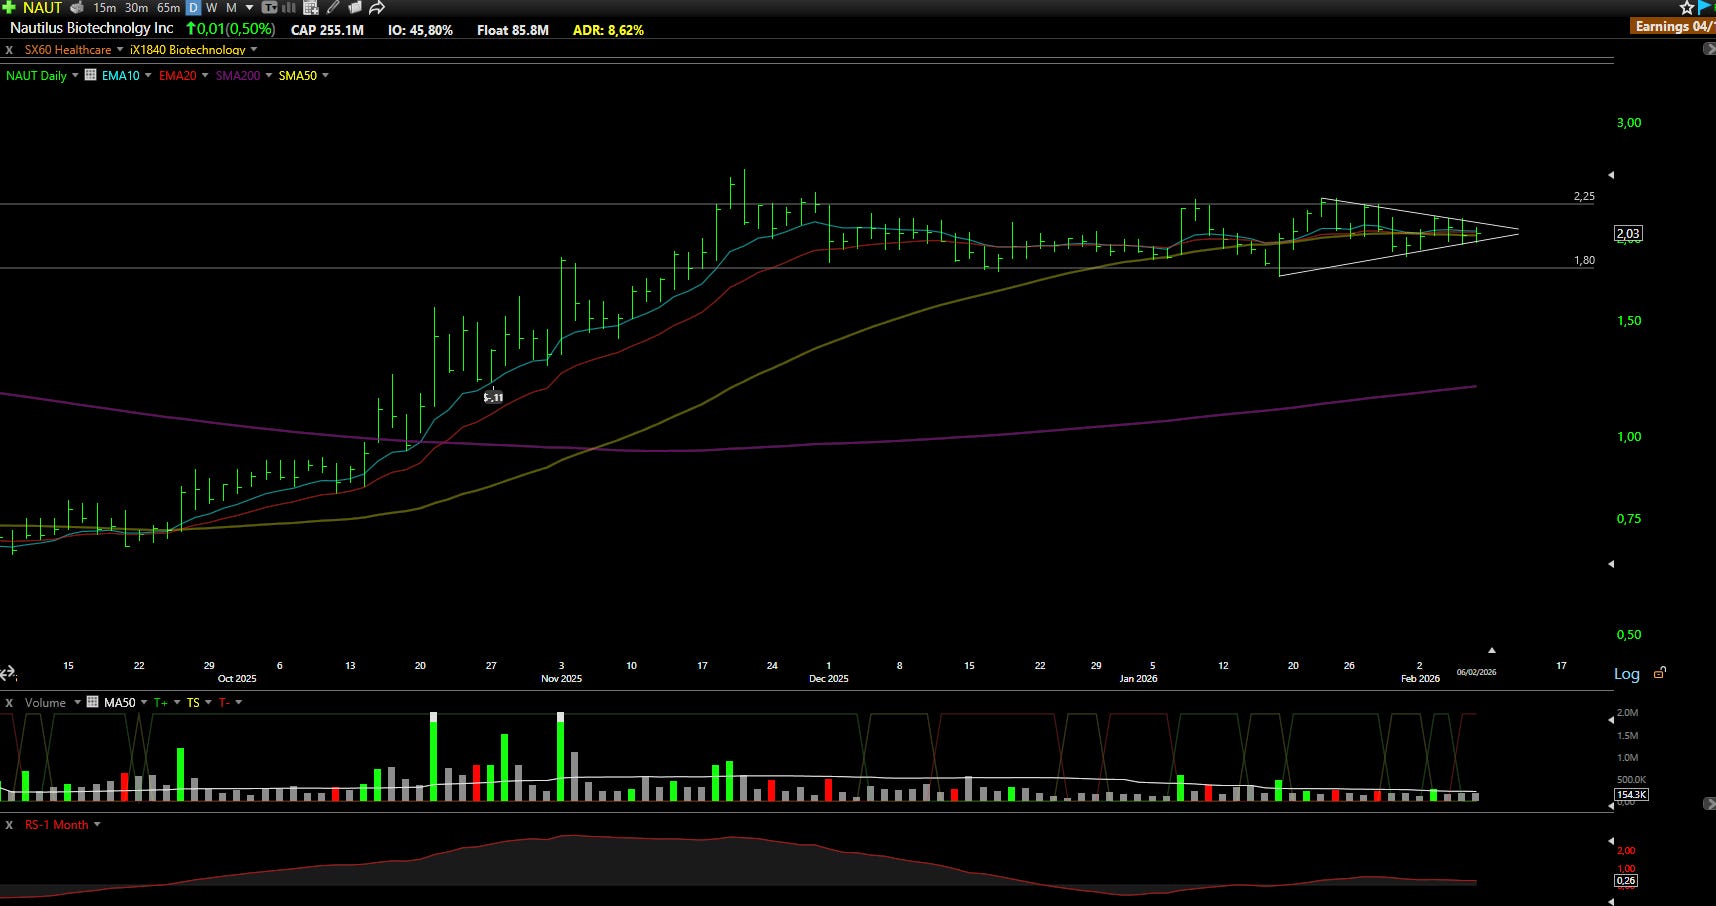
Technical Outlook: The stock has been consolidating for approximately three months, and the monthly chart looks particularly constructive, forming a flag pattern. On the weekly timeframe, the price action resembles a Darvas box. Currently, the stock is highly compressed, as are the three main moving averages, which are converging tightly. This compression typically precedes a significant move: the question is whether it breaks to the upside or downside. Volume and price action over the coming sessions should provide clues about which direction is more likely. This is a watch-and-wait situation where patience will be rewarded with clarity.
VELO: Velo3D Inc ⚠️
What they do: A provider of advanced metal 3D printing solutions
Why watch? Velo3D isn’t simply selling 3D printers; it’s offering a complete end-to-end solution for producing metal parts that cannot be manufactured through conventional methods. The company serves industries where precision and reliability are non-negotiable: defense, aerospace, space exploration, energy infrastructure, and semiconductor equipment manufacturing.
These customers rely on Velo3D’s unique capabilities to produce components with extreme complexity: think rocket engines with intricate internal cooling channels, aerospace parts that must be incredibly lightweight without sacrificing structural integrity, or semiconductor components with internal geometries impossible to achieve with traditional CNC machining. The value proposition is clear: Velo3D enables its customers to build things that simply couldn’t exist otherwise.
The company is attempting a challenging but potentially rewarding business model transition: moving away from volatile, hardware-driven revenues toward a more stable and scalable model centered on services and recurring revenue streams. If management executes successfully and there are early indications suggesting progress, Velo3D could achieve profitable growth and unlock significant operating leverage.
Recent developments underscore the company’s strategic positioning. Velo3D has deepened its role in aerospace and defense manufacturing, highlighting expanded partnerships with SpaceX and Anduril, two of the most innovative and well-funded companies in their respective sectors. These relationships provide both revenue visibility and validation of the technology’s capabilities.
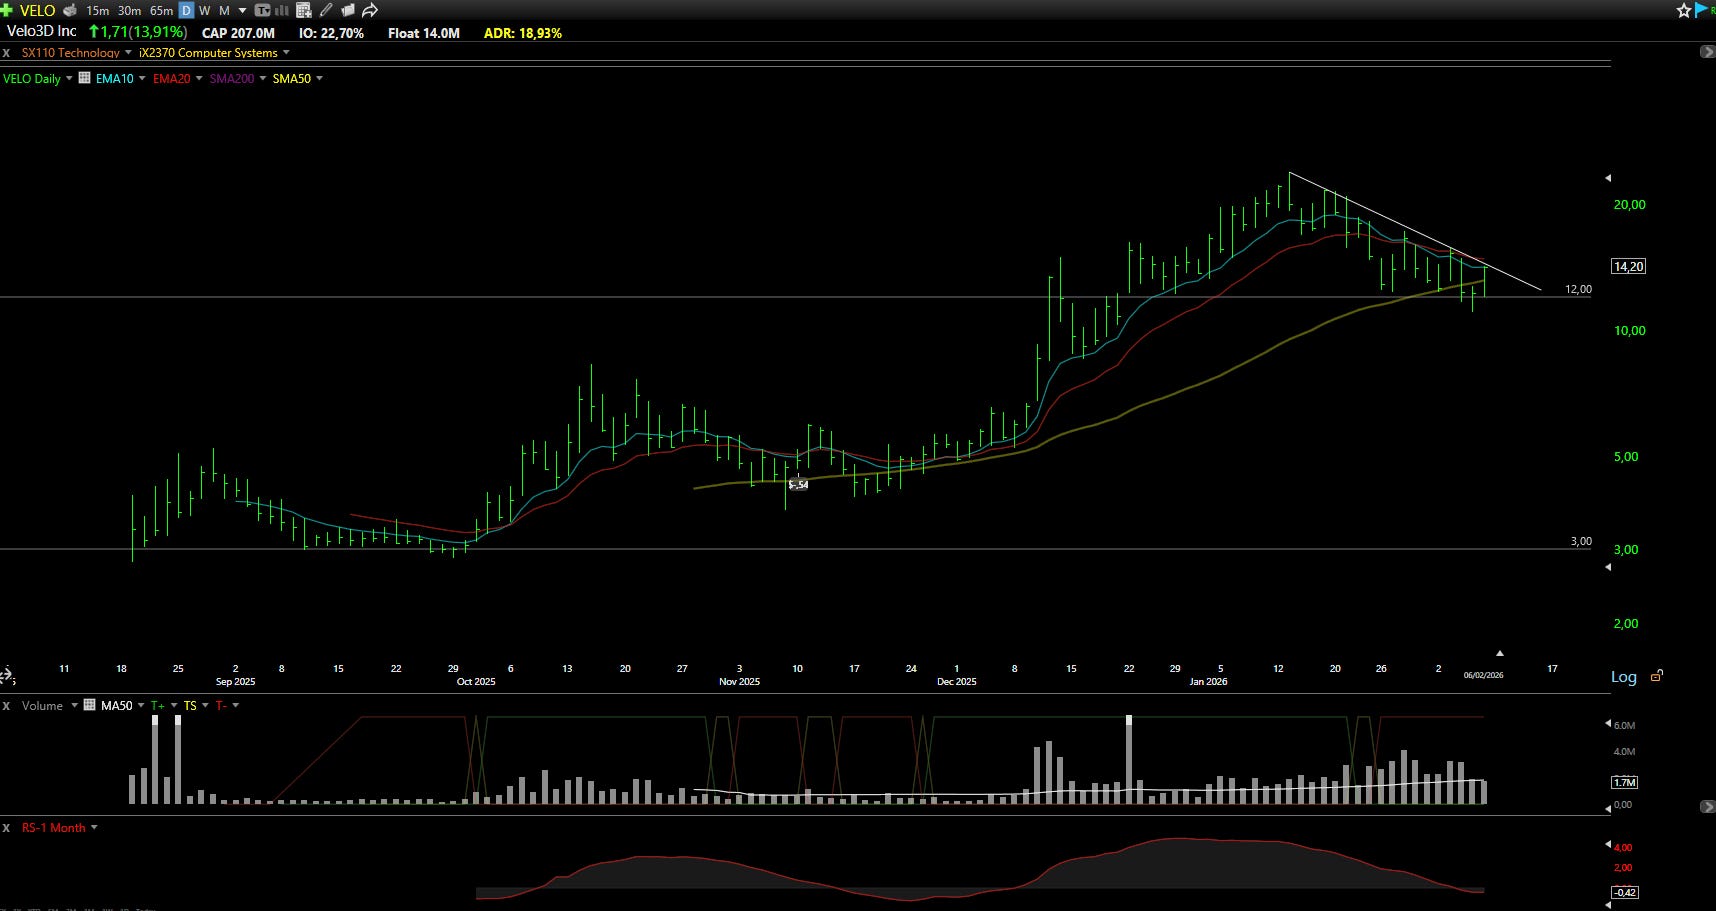
Technical Outlook: The stock has made an explosive move higher and is now experiencing a significant pullback, though “significant” is relative when you consider that Velo3D has a 19% average daily range. This is an extremely volatile stock, and finding a tight-risk setup is genuinely difficult. The price action resembles a wild horse: powerful and fast-moving, but hard to control.
That said, this is a fascinating story that deserves attention from investors willing to tolerate elevated risk. If you’re considering a position, treat it with a smaller size than you would typically use and be prepared to widen your stop-loss to account for the volatility. This isn’t a stock for conservative portfolios, but for those with appropriate risk tolerance and position sizing discipline, the potential rewards could be substantial. Just remember: volatility cuts both ways.
These tickers below didn’t make the main cut, but they’re on our radar for a reason. We’ve vetted them; now you decide if they fit your game.
More opportunities, less noise.
⚡📋Scanned Stocks: Quick Picks
CRVS - Corvus Pharmaceuticals Inc
VG - Venture Global Inc
LRN - Stride Inc
CGEM - Cullinan Therapeutics Inc
DIOD - Diodes Inc
"The stock market is the story of cycles and of the human behavior that is responsible for overreactions in both directions."
Seth Klarman
Disclaimer: This analysis is for informational purposes only and should not be considered financial advice. Always conduct your research and consult with a licensed financial advisor before making investment decisions.