The Ending We Were Given
In a study published in 1988, Jonathan Baron and John Hershey gave students the case of a 55-year-old man whose heart condition had forced him to stop working. An operation could relieve his pain and extend his life, but it carried a risk of death. His physician decided to proceed.
The students encountered two versions of the case. In one, the operation succeeded. In the other, it failed and the patient died. They judged the physician’s decision more favourably when it succeeded, although the information available when he made it was identical. The researchers called this outcome bias.
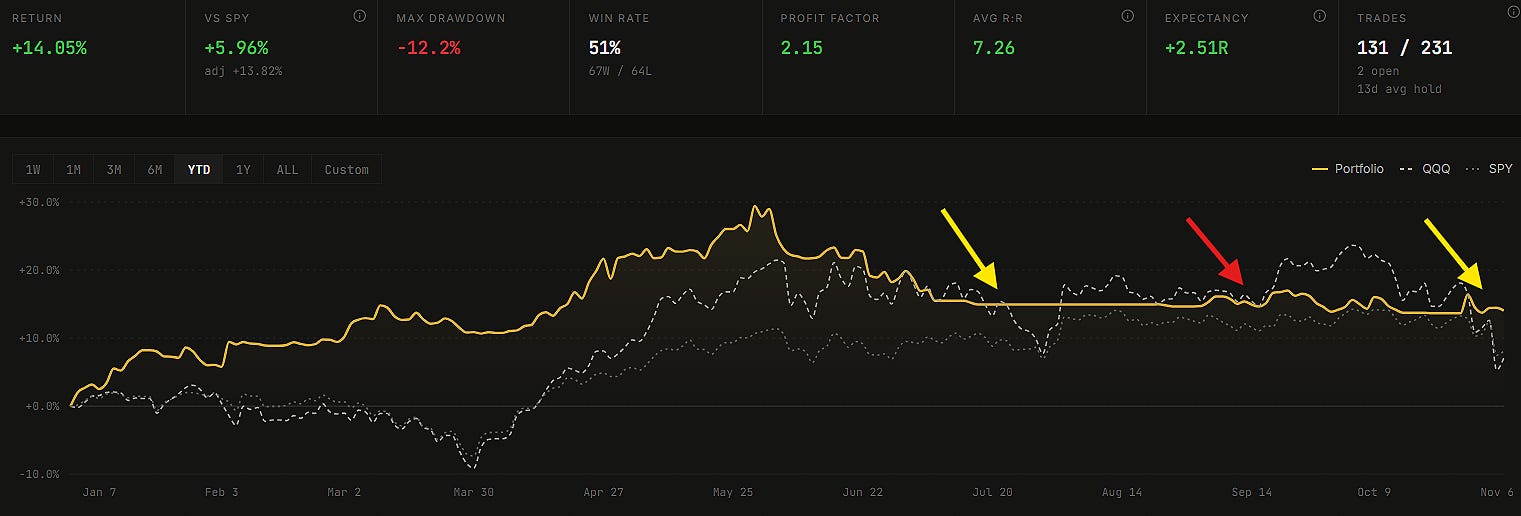
Our portfolio chart has been giving us a much less serious version of that questionnaire. We have managed to feel like a genius, an idiot and a genius again while spending much of the period largely in cash.
At the first yellow arrow, the market is falling and our account is barely moving. Staying defensive feels sensible. Around the red arrow in September, the market rallies and we are underinvested. The discomfort gets worse when we open X or Reddit and find somebody posting another 200% winner.
By the final yellow arrow, after the market rolls over, we feel clever again.
Thursday’s 5.5% fall in the Nasdaq Composite makes it tempting to give our recent decisions a generous review. September deserves to stay in that review too. We had reasons to keep exposure low before we knew which way the next few weeks would go.
During June and July, we kept pushing as trading became choppier and gave back roughly half the gains accumulated earlier in the year. We adjusted too slowly. From July, we substantially reduced exposure and the number of attempts we made, then had to tolerate the frustration of missing part of the rally.
The account now stands at +14.05% year to date, without options or leverage. We still have one position contributing positively through the selling and added another on Friday that could benefit if conditions settle. Overall exposure remains low.
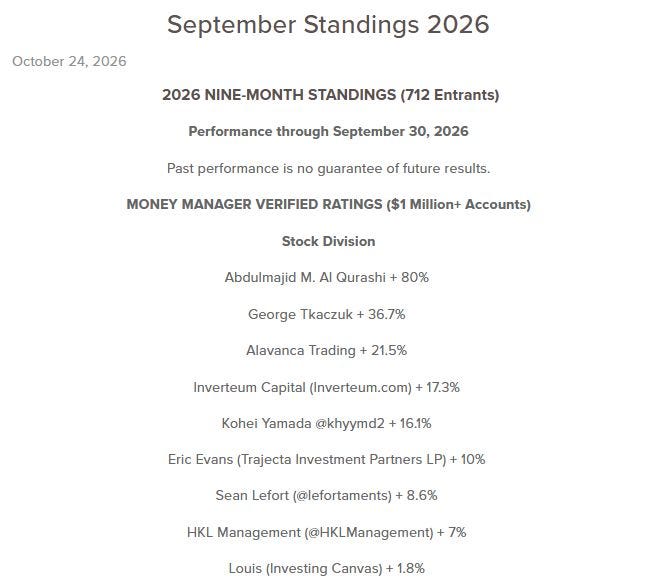
The Money Manager Verified Ratings stock table, published alongside the US Investing Championship standings, includes single-digit gains and much higher returns. The figures cover the period through September 30, and the accounts take different risks. Our own 14% comes with a summer giveback we should have reduced, followed by months in which we have preserved most of what remained.
History can supply several endings for a week like this.
After daily losses near 6% to 7%, the Nasdaq Composite’s returns over roughly two months were about −10% from October 7, 2008, +9% from August 8, 2011, and +17% from April 3, 2025, using Nasdaq closing data through FRED.
We cannot build a December forecast from those three episodes.
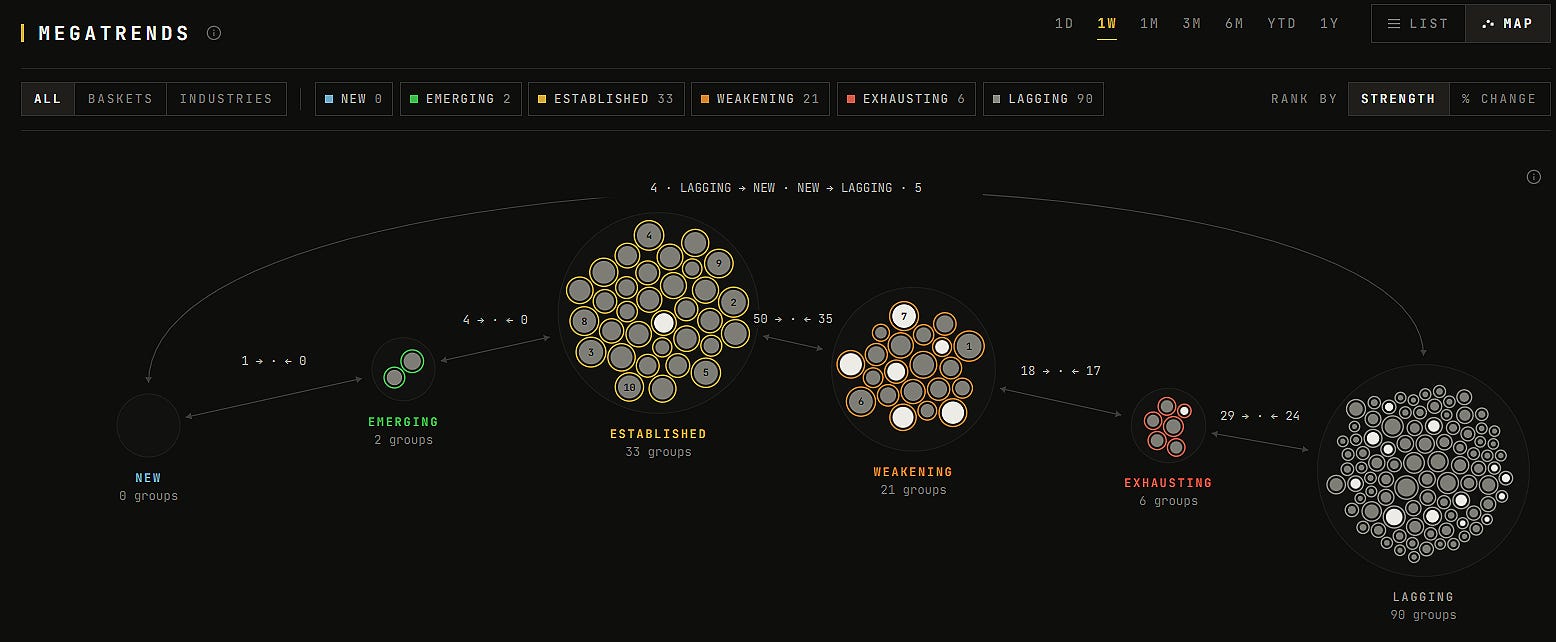
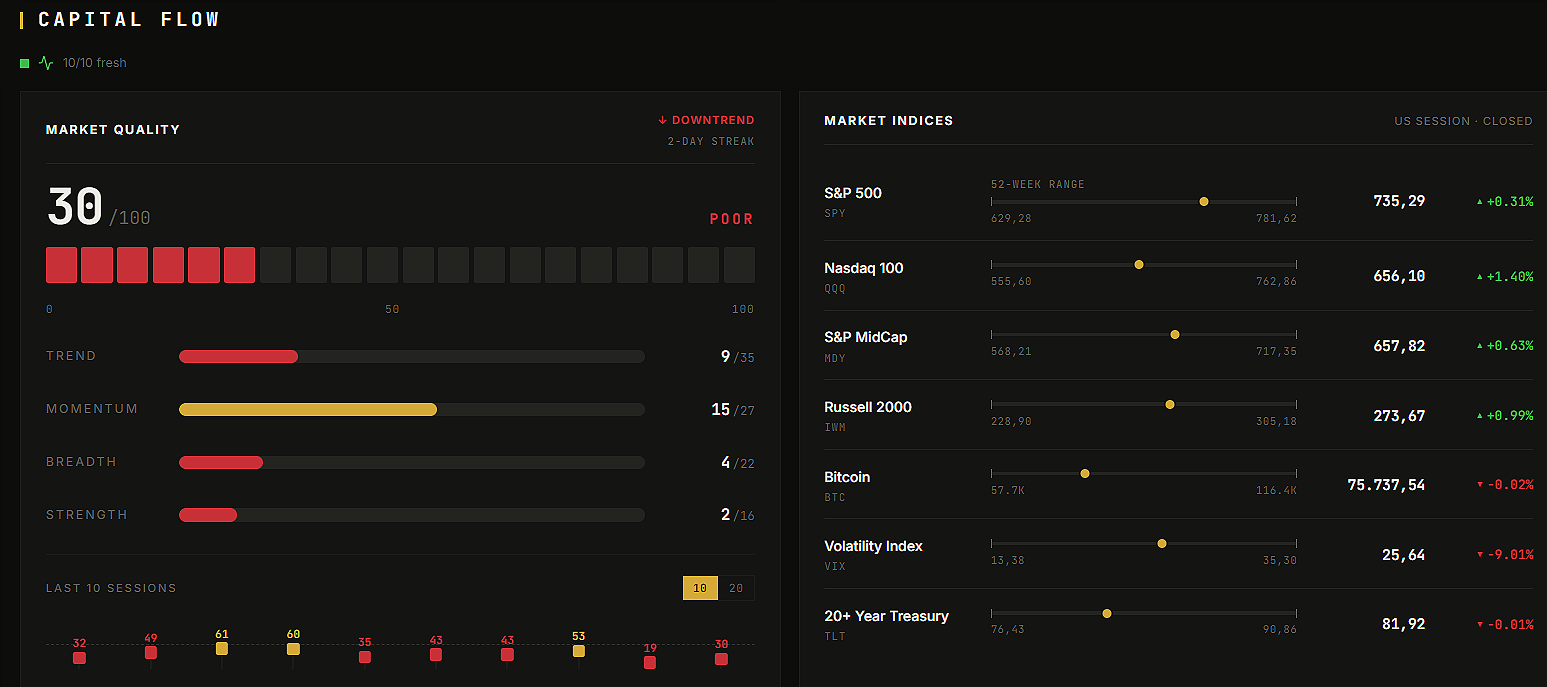
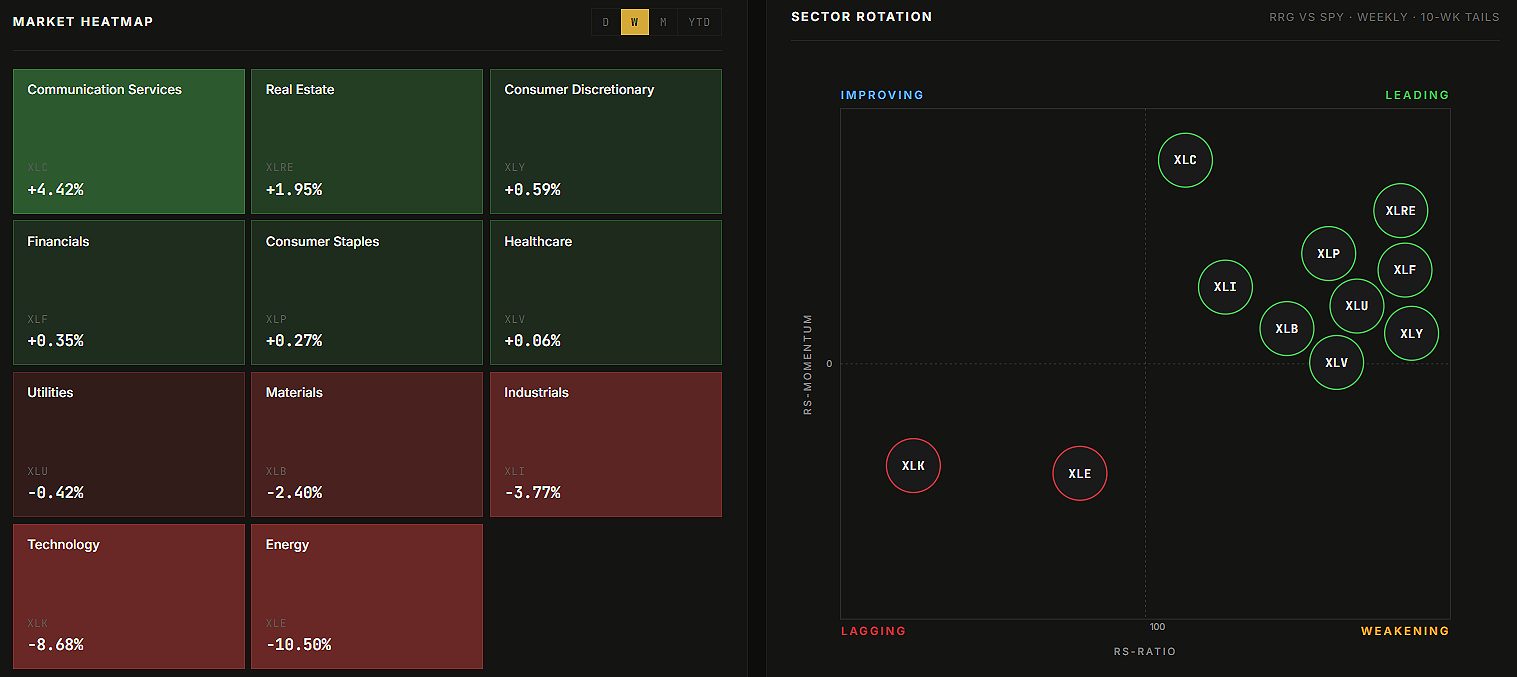
Our current TradeDeck readings still give us reasons to keep exposure low. Nearly 120 of the 155 industry groups we track are Lagging, Exhausting or Weakening. Life Insurance and Apparel Manufacturing are the two Emerging groups we are following, with apparel entering that category only this week. Established leadership remains scarce.
We are not here to predict, but to react.
We can increase exposure when those readings improve and more of our setups start working. Like the physician in the questionnaire, we had to make our September decision before we knew the outcome. If another rally makes us feel foolish for holding cash, we will go back to the readings and the behaviour of our trades before putting more money to work.

Here’s a look at this week’s market health, with a breakdown of index and sector performance.
📈 Free Setup: Make It Count
XYZ: Block, Inc.
What they do: A financial technology company.
Why watch? Square handles payments for businesses, while Cash App lets consumers transfer money, spend and borrow. Block connects those two customer bases through Neighborhoods, its discovery and rewards service, which gives Square merchants a way to reach Cash App users.
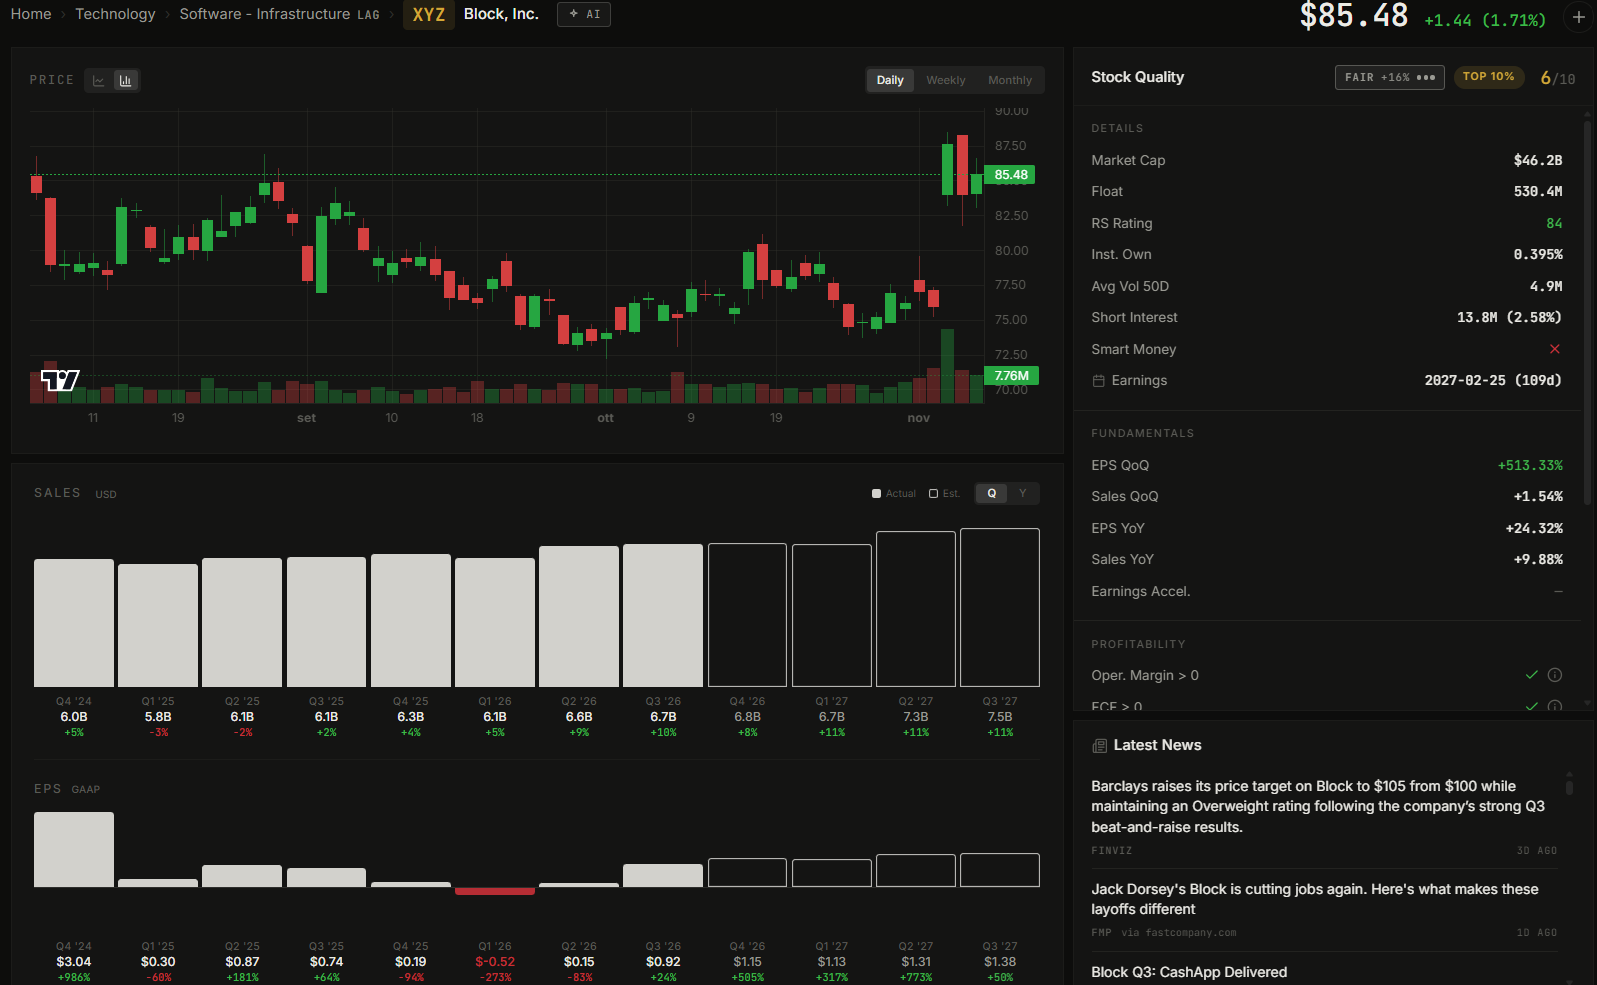
September’s Cash App transacting accounts reached 60 million, while its third-quarter gross profit grew 27%. Square’s payment volume and gross profit both grew 14%. Across Block, gross profit increased 22% to $3.24 billion. Gross profit is particularly useful here because reported revenue includes customers’ bitcoin purchases, which contribute substantial sales but comparatively little profit.
The existing customer base gives Block room to earn more from each relationship. A customer who begins with money transfers can add a spending card, have wages deposited or use a short-term loan. Block earns fees and interest from those services and takes on credit risk as it lends more. Transaction, loan and consumer-receivable losses rose roughly 66% in the quarter. Those losses sit below gross profit in the accounts, so the headline growth figure does not deduct them.
Adjusted operating income reached $923 million, compared with reported operating income of $428 million. Block also has a $764 million provision toward a proposed resolution of the Justice Department’s anti-money-laundering investigation. That is the total recorded to date, including amounts accrued before this quarter. Final terms and court approval are still outstanding.
Block has also begun testing Buzz, an AI work environment originally developed for its own teams, with external customers through Builderlab. An introductory event is scheduled for November 10, with initial revenue expected in the fourth quarter.
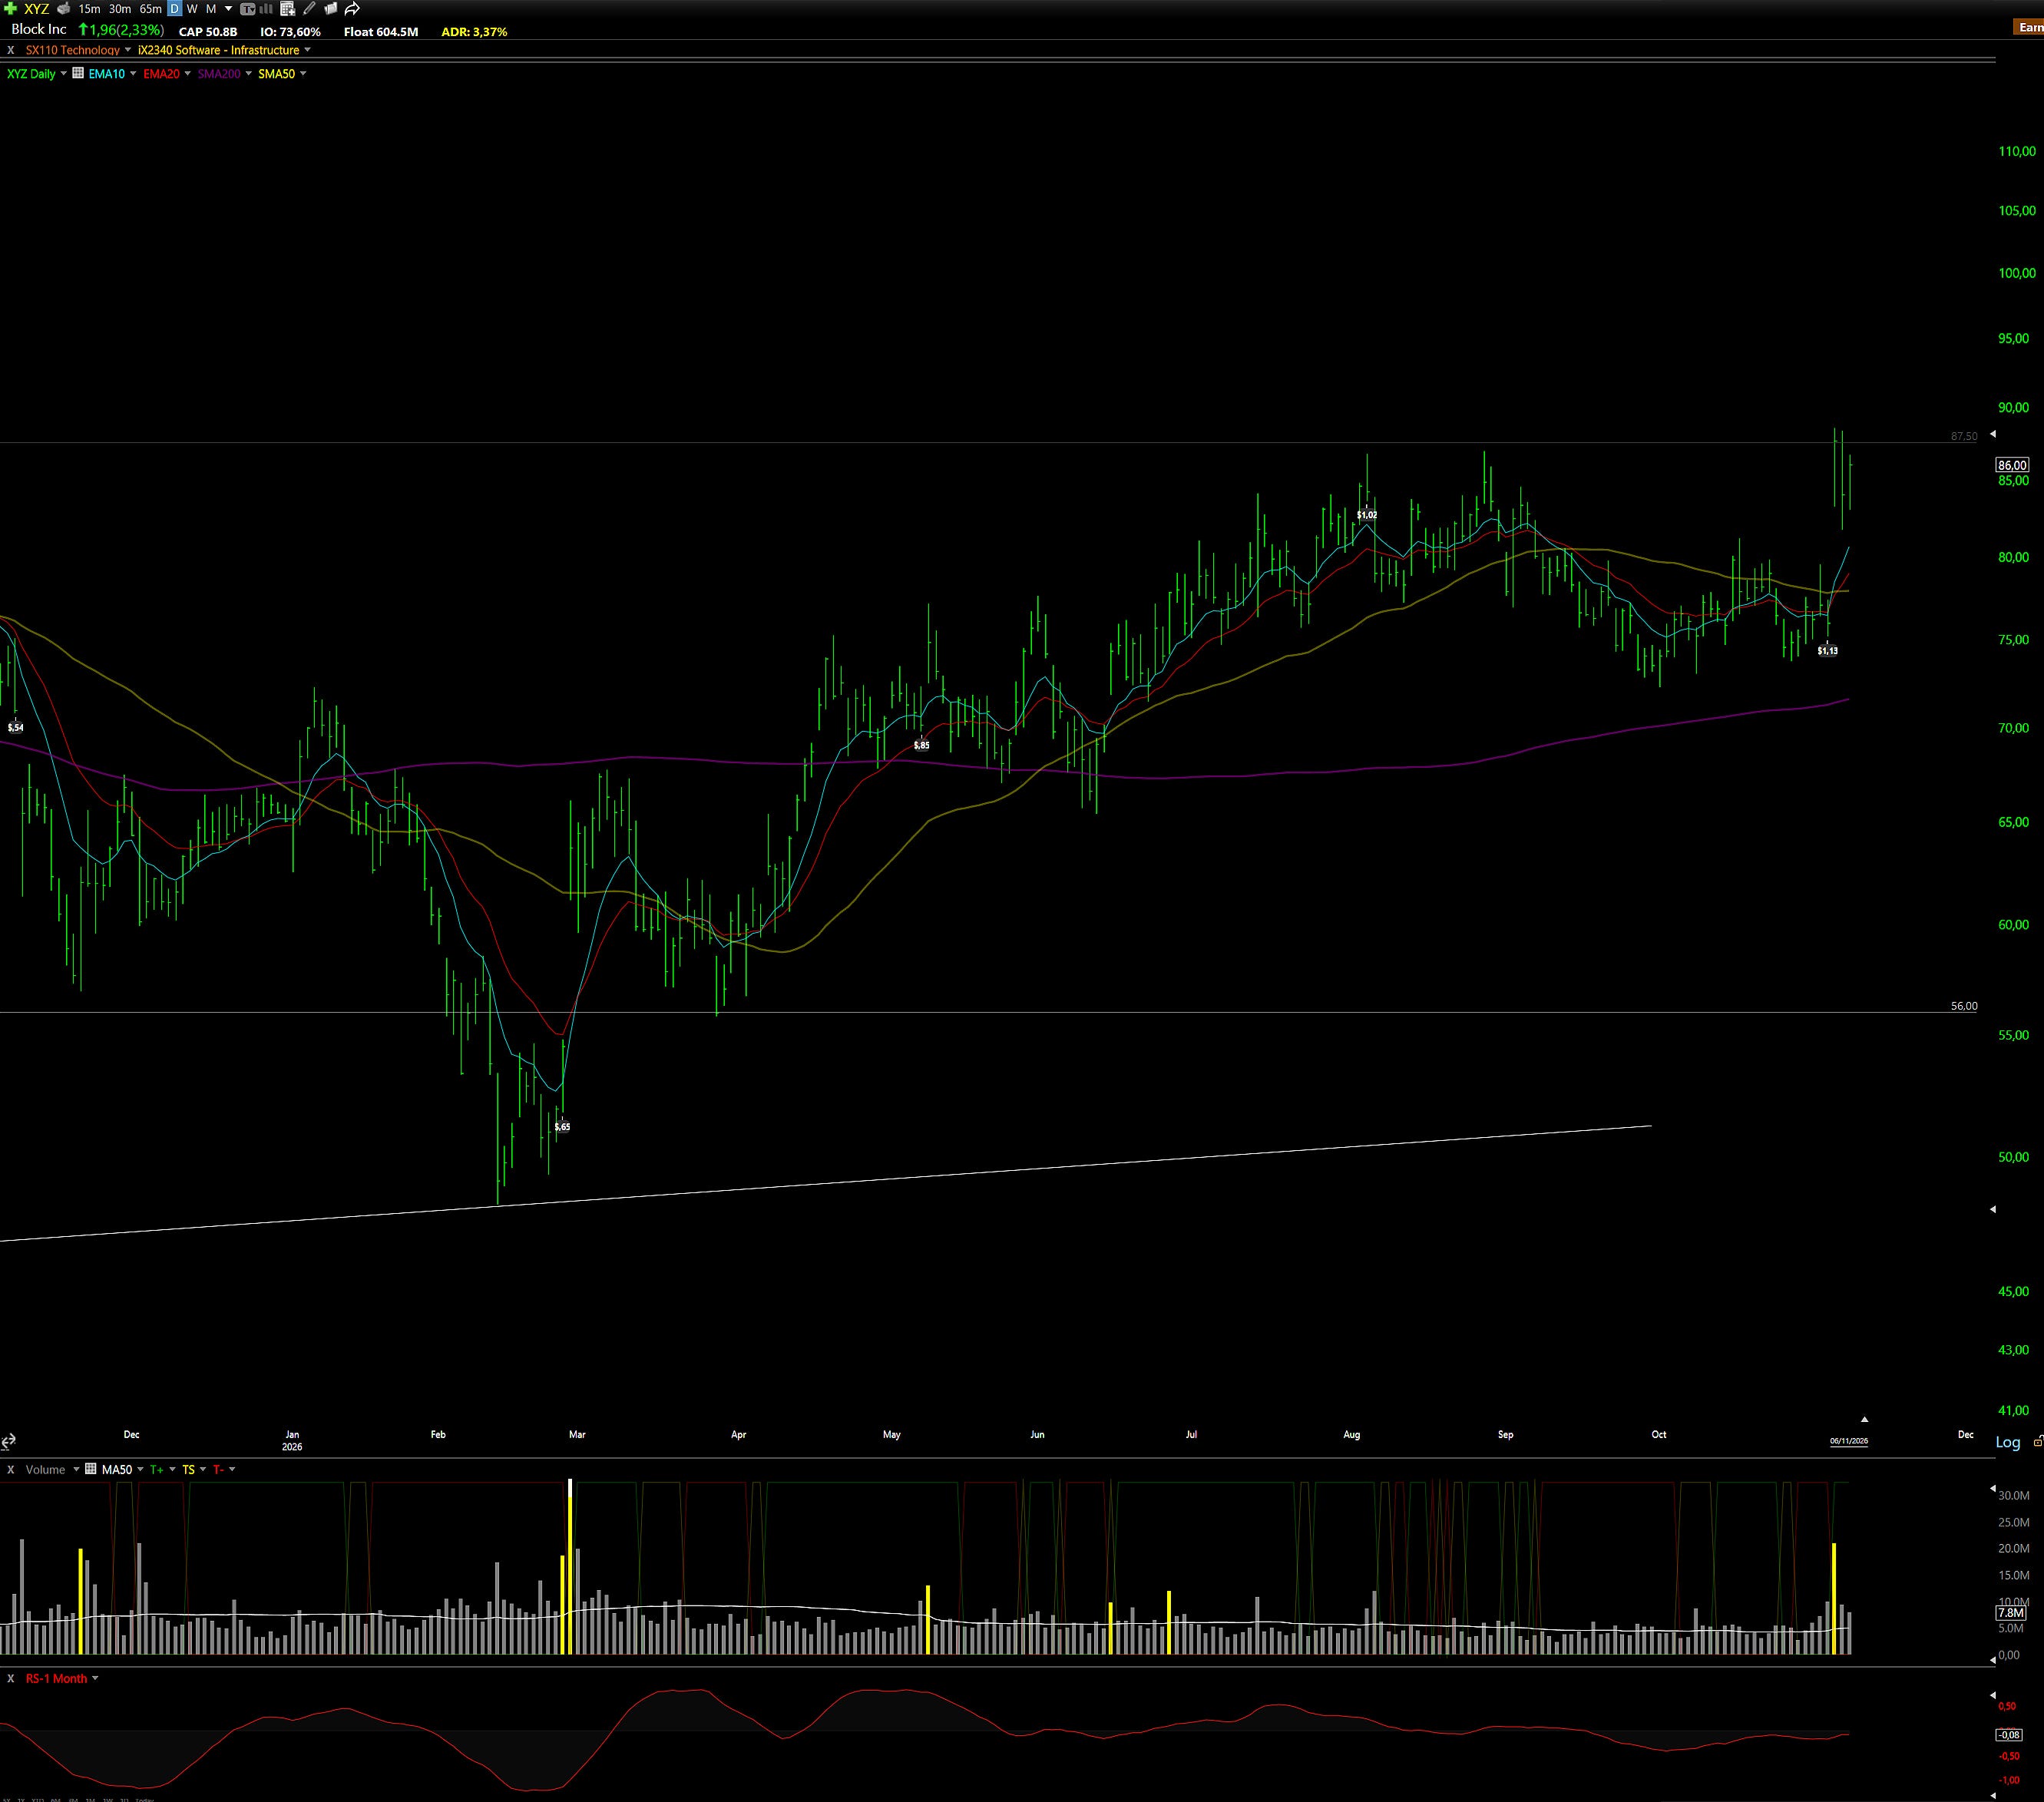
Technical Outlook: Block has spent roughly four years working through a broad base, with $87.50 marking the upper boundary since March 2022 and $55.50–56 the main reference below. The monthly chart has produced three progressively higher lows, in 2023, 2025 and 2026. Each briefly took price below that lower area before it recovered, while most of the trading has remained inside the range.
The latest earnings sent the stock roughly 15% higher and brought it back to $87.50. Sellers defended that level again, and the following pullback has left us waiting beneath resistance. We would like a couple of quieter sideways sessions now, with volume easing after the surge around the report. Ideally, the 10-day EMA would have time to catch up with price and provide an initial support before another attempt at $87.50.
The November 5 low, just below $82, gives us a reference for a possible trade. A stop around $81.50, or $81 as the outer limit, would sit beneath that low. We’d like that pullback to settle before a second leg higher. A break through $87.50 would also take price out of the larger base.

What €39/month (or 299€/year) buys:
Free Access to TradeDeck
Premium members get full access to the trading platform we’re building. The value of the platform alone almost exceeds the cost of the subscription.
Watchlist Elite (5-7 Stocks)
Each selection undergoes rigorous financial analysis, technical evaluation, and strategic assessment.
Full Portfolio Transparency
Every position we hold. Entry price. Current P&L. Stop level. Real money, real risk.
Real-Time Portfolio ( and Chat Access)
This is where the edge lives. Exact entries, stops, and position sizing. Real-time..
The Tools We Actually Use
Member discounts on TC2000, FMP, and other platforms: same tools, better pricing.
What Paid Members Say: