Wall Street Radar: Stocks to Watch Next Week
Volume 107


The Readings After the Shock
On November 14, 1969, Apollo 12 was struck by lightning twice during its launch. The electrical disturbance disrupted the readings coming back from the spacecraft. Flight controller John Aaron recognised the problem and recommended switching the signal-conditioning equipment to its auxiliary setting. That restored usable information while the rocket was still climbing. The crew eventually reached the Moon and returned safely.
What interests us is the work between the lightning strike and the decision to continue.
Someone had to establish what was still functioning. A frightening event had happened, and the condition of the machinery still needed to be assessed.
Technology investors have had plenty of frightening events to absorb. Nvidia’s announcement of Jensen Huang’s departure adds a difficult leadership transition to an already damaged market. We have enormous respect for his technological contribution. His private life can stay outside this discussion, and we understand a board’s responsibility to uphold corporate standards. Losing someone with his influence and technical vision is still a considerable loss.
The market was struggling before that announcement. The Nasdaq Composite fell 5.5% on November 5, followed by a relief rally.
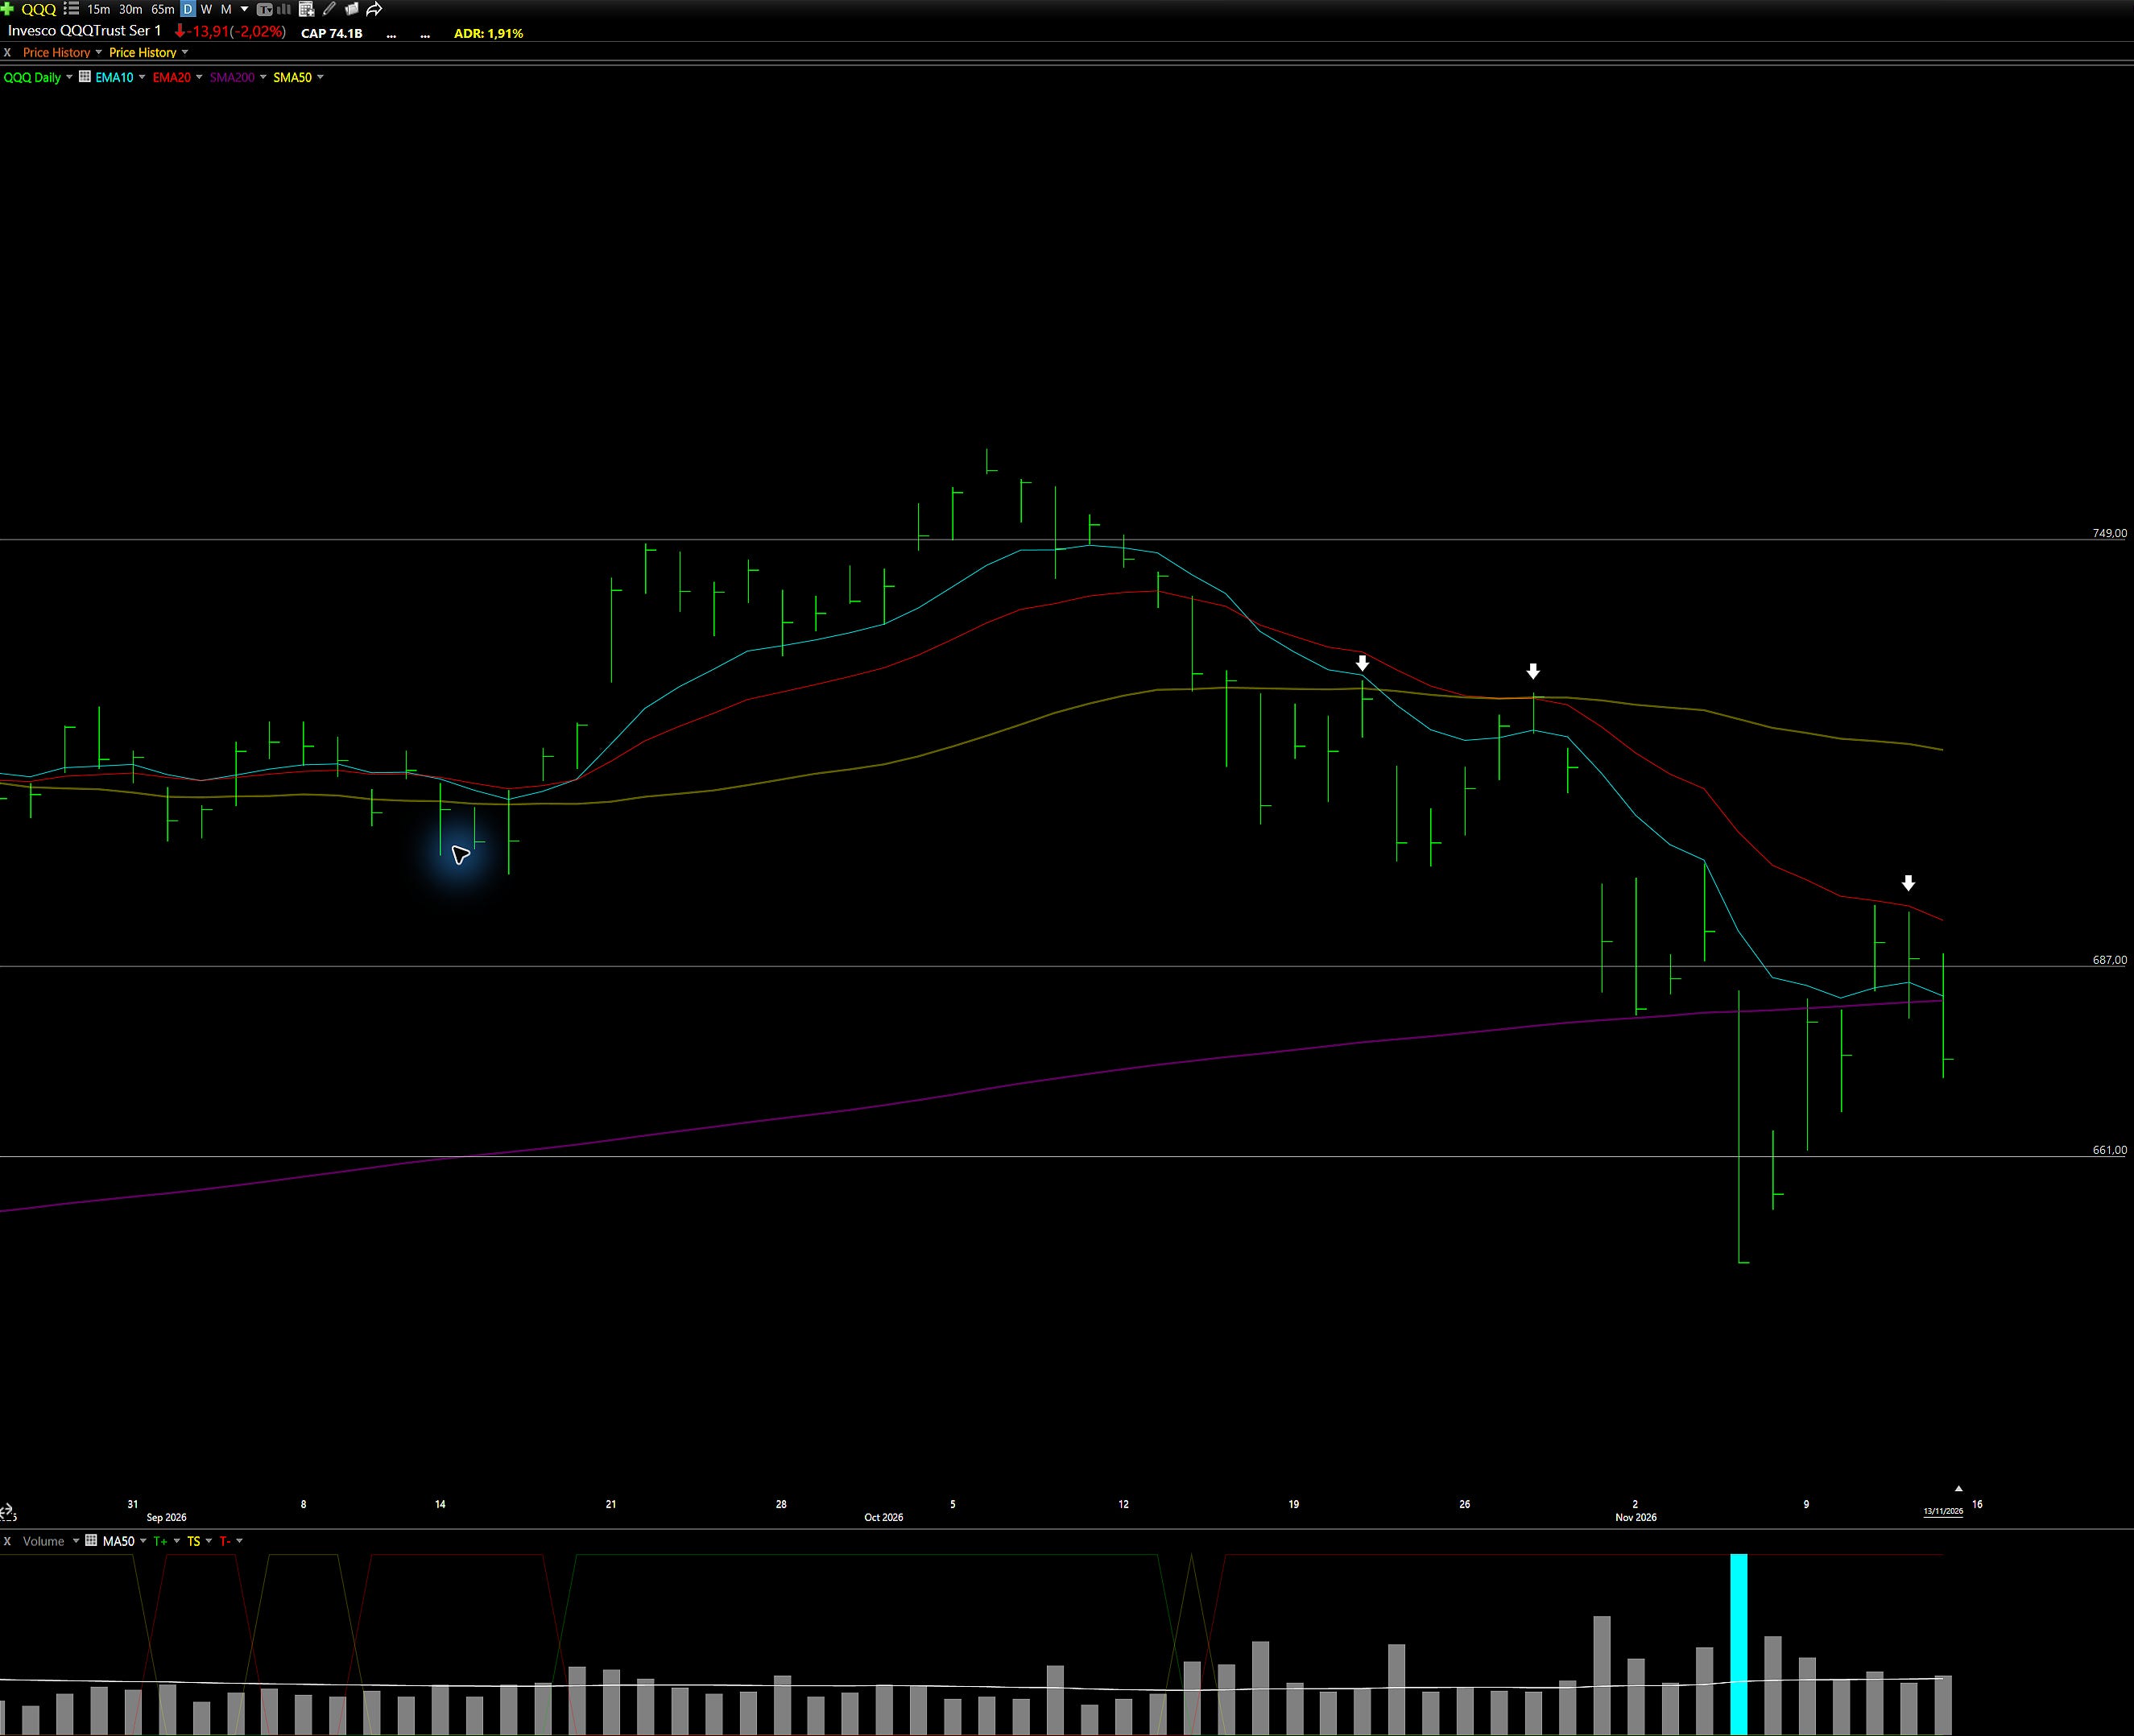
On our QQQ chart, the two earlier recovery attempts after October’s first leg down ran into the 50-day simple moving average. This latest bounce only reached the area of the 20-day exponential moving average before Friday’s selling. Those averages remain overhead resistance, and the sequence still looks like a downtrend.
Yet our weekend scan produced considerably more setups than usual.
SPY looks somewhat healthier than QQQ, and the Russell small caps have the strongest structure of the three in our reading. We are finding individual charts worth working on inside a market that still demands caution.
Our TradeDeck industry readings have improved a little too.
Apparel Manufacturers, Railroads and Regulated Electric Utilities are Emerging; Renewable Utilities has entered the New category. Discount Stores, Household and Personal Products, Beverages and parts of transport and construction also feature among the healthier groups. Luxury Goods, Healthcare Plans and Regulated Gas add to that picture. These businesses span consumer spending, essential services and infrastructure, with very different economic sensitivities.
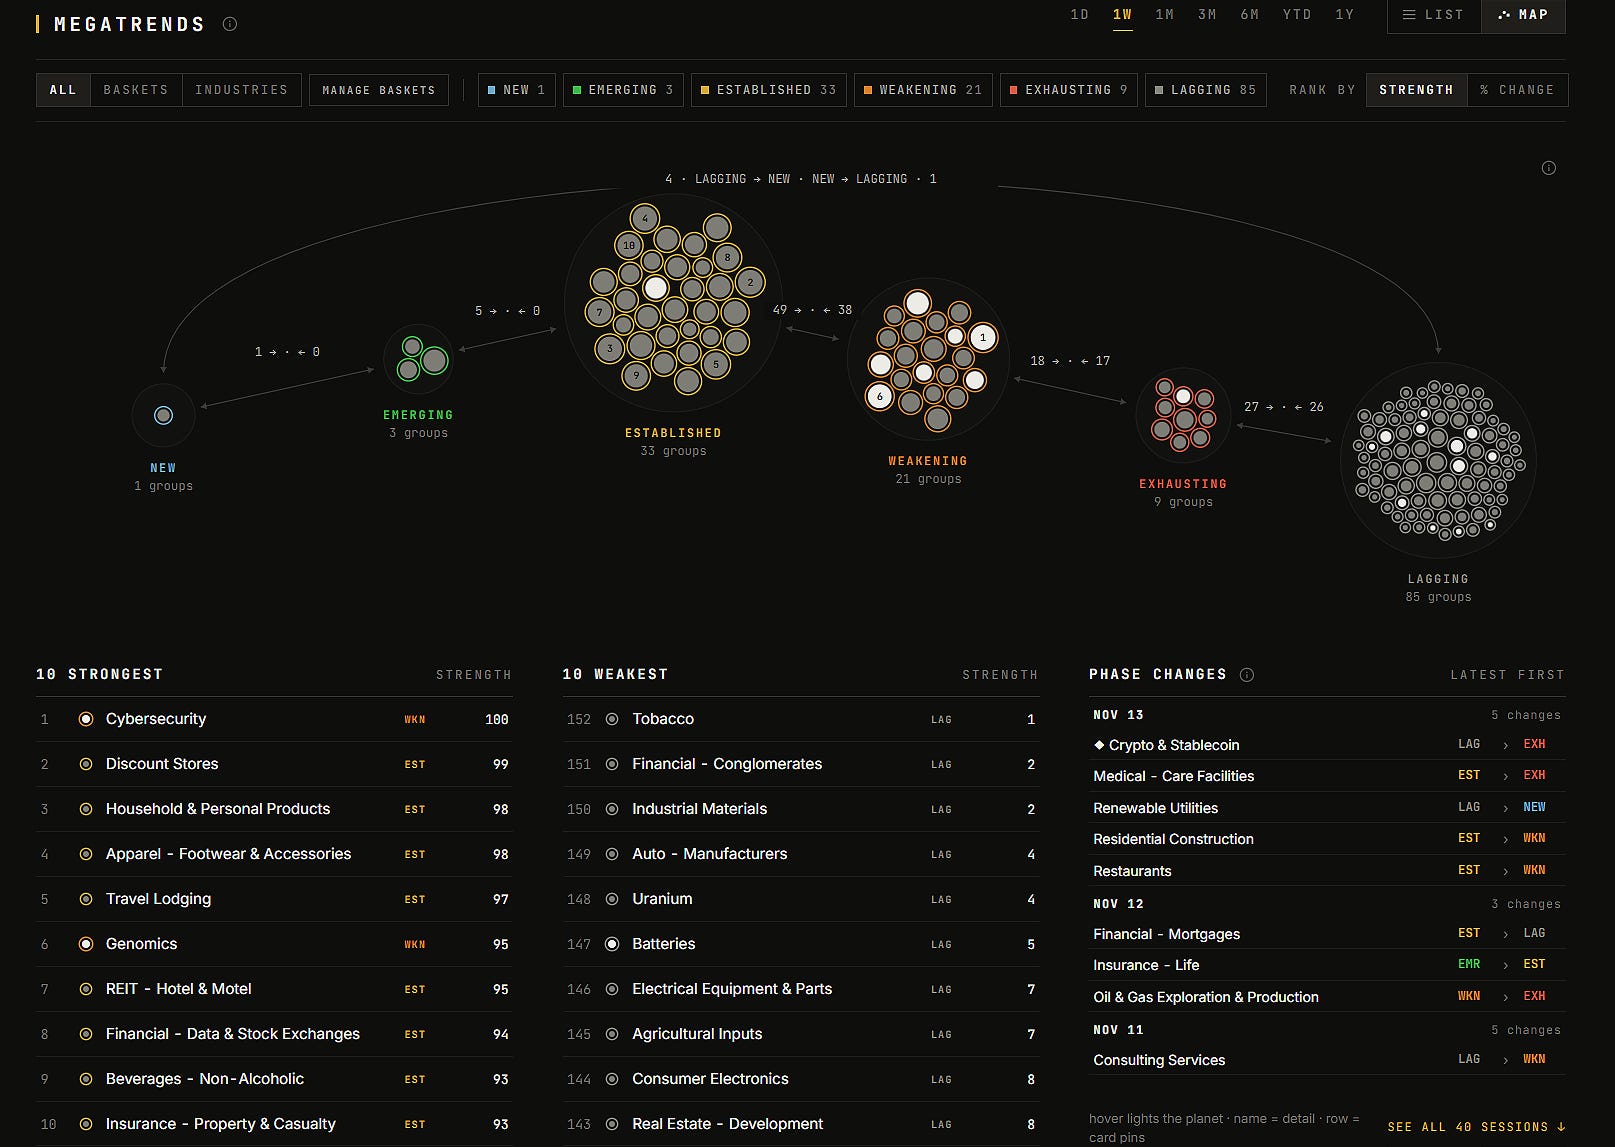
Cybersecurity remains the strongest group on our screens, although its readings are deteriorating. Much of AI-related and speculative technology continues to struggle. We have some functioning parts to examine, with weakness still concentrated in several of the market’s most influential names.
Aaron’s intervention gave the crew information they could use to assess the spacecraft. Our scan gives us individual setups to assess, and we want to see how they behave through the next bout of selling. If they hold their consolidations and attract buyers on breakouts, we can work with that evidence. The index resistance remains part of the decision until price clears it.

Here’s a look at this week’s market health, with a breakdown of index and sector performance.
[Index and sector performance images: to be added]
📈 Free Setup: Make It Count
APP: AppLovin Corporation
What they do: A marketing technology company
Why watch? Advertisers keep spending when they can see that an ad is bringing in customers. AppLovin’s AXON technology helps match advertising with users likely to respond, while MAX runs the auction through which app publishers sell their advertising space. Better results for advertisers can support higher bids, giving publishers more reason to keep that inventory available through the platform.
That business produced $2.18 billion of third-quarter revenue, up 55%, and around $1.4 billion of free cash flow, the cash left after operating expenses and capital spending. Its adjusted EBITDA margin reached 84%. Management expects fourth-quarter revenue of roughly $2.37 billion to $2.40 billion.
The expansion into advertising for products beyond mobile games gives AppLovin more potential customers. Bringing those advertisers into the same system could increase competition for ad space, provided the campaigns deliver enough sales to justify continued spending.
AppLovin also depends on access to mobile users and data under rules largely set by other platforms. Changes to privacy policies or advertiser returns can affect that business, and its commercial dispute with Unity remains unresolved.
Technical Outlook: The earnings gap carried APP forcefully through the $335 weekly resistance level. After the initial advance, price has settled into a nearly horizontal flag, trading between roughly $390 and $412 while volume contracts.
The declining 200-day SMA runs through this consolidation and is still creating resistance. We would prefer another couple of quiet sessions, allowing the range to tighten and the rising 10-day EMA to catch up with price. That shorter average gives more weight to recent closes and could provide a closer support reference. The stock has held much of the earnings move while working through that overhead supply.
A break above the flag could offer a continuation setup next week. Until then, we are watching how well the lower part of the range holds and whether the consolidation gives the moving average time to close the distance.


What €39/month (or 299€/year) buys:
Free Access to TradeDeck
Premium members get full access to the trading platform we’re building. The value of the platform alone almost exceeds the cost of the subscription.
Watchlist Elite (5-7 Stocks)
Each selection undergoes rigorous financial analysis, technical evaluation, and strategic assessment.
Full Portfolio Transparency
Every position we hold. Entry price. Current P&L. Stop level. Real money, real risk.
Real-Time Portfolio ( and Chat Access)
This is where the edge lives. Exact entries, stops, and position sizing. Real-time..
The Tools We Actually Use
Member discounts on TC2000, FMP, and other platforms: same tools, better pricing.
What Paid Members Say:
Portfolio updates & Full Watchlist:
